Iceberg
2017
Data visualisation, UIUX, identity
Data visualisation, UIUX, identity
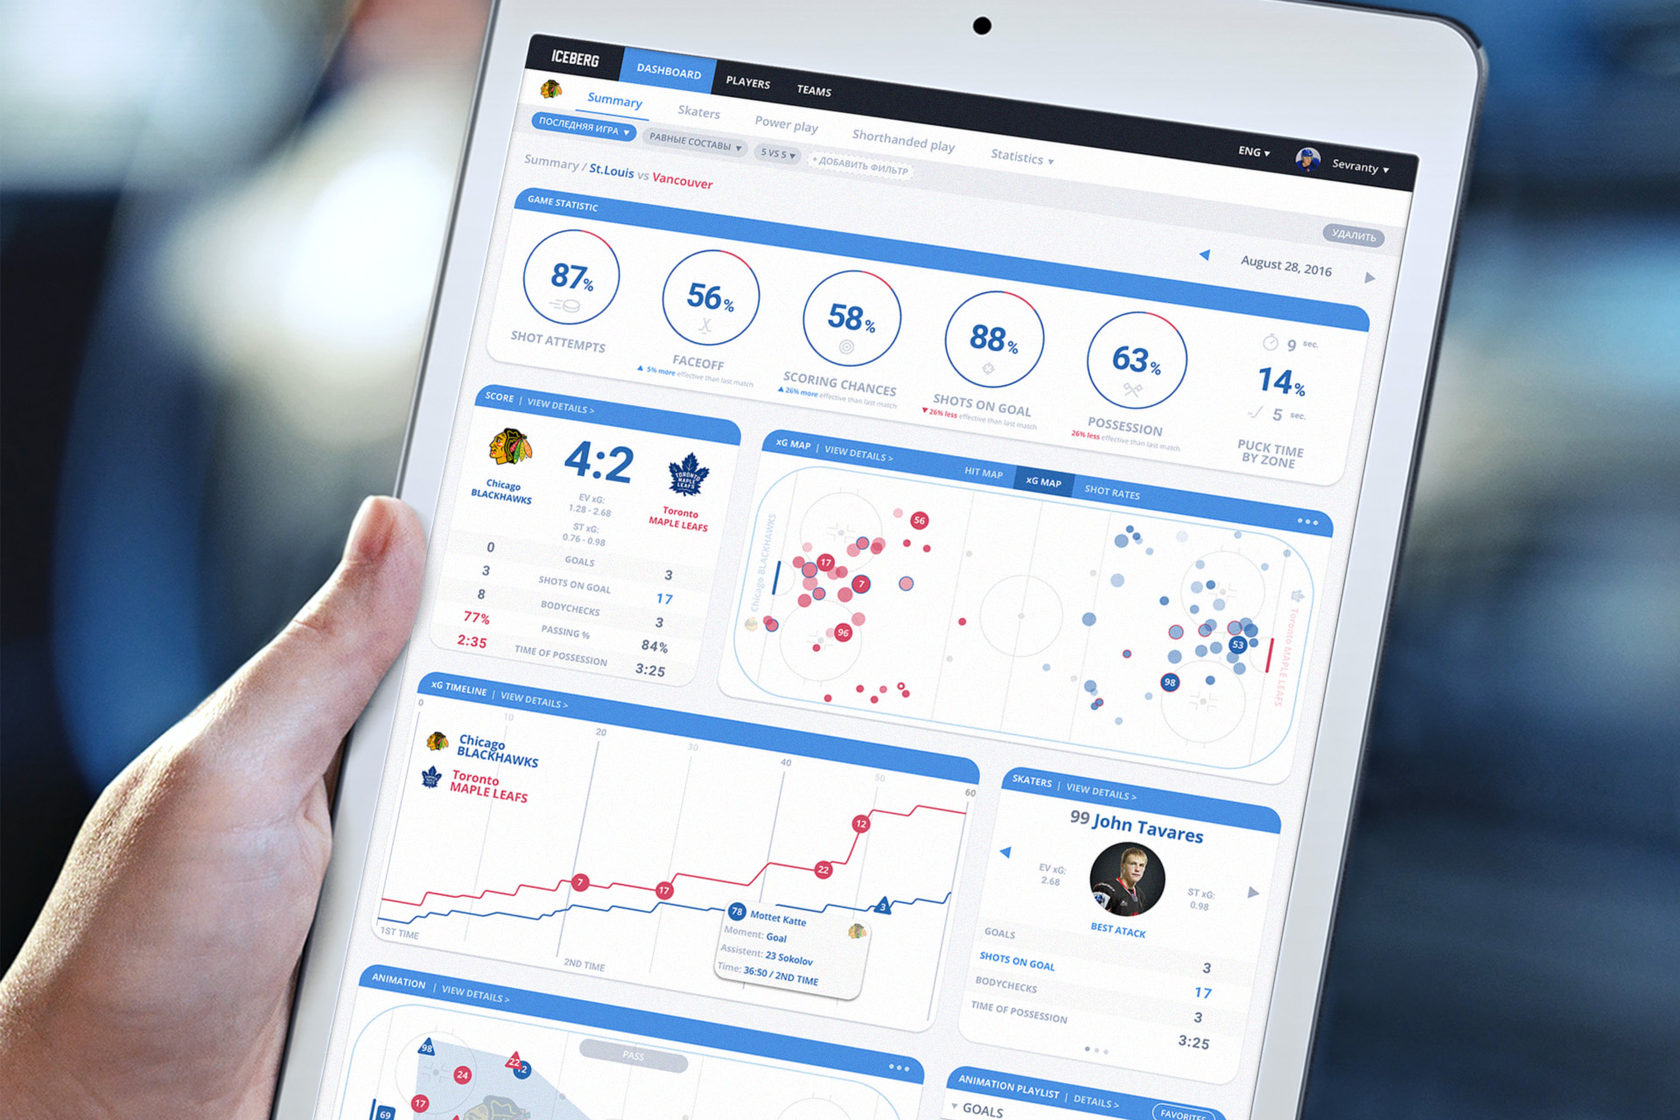
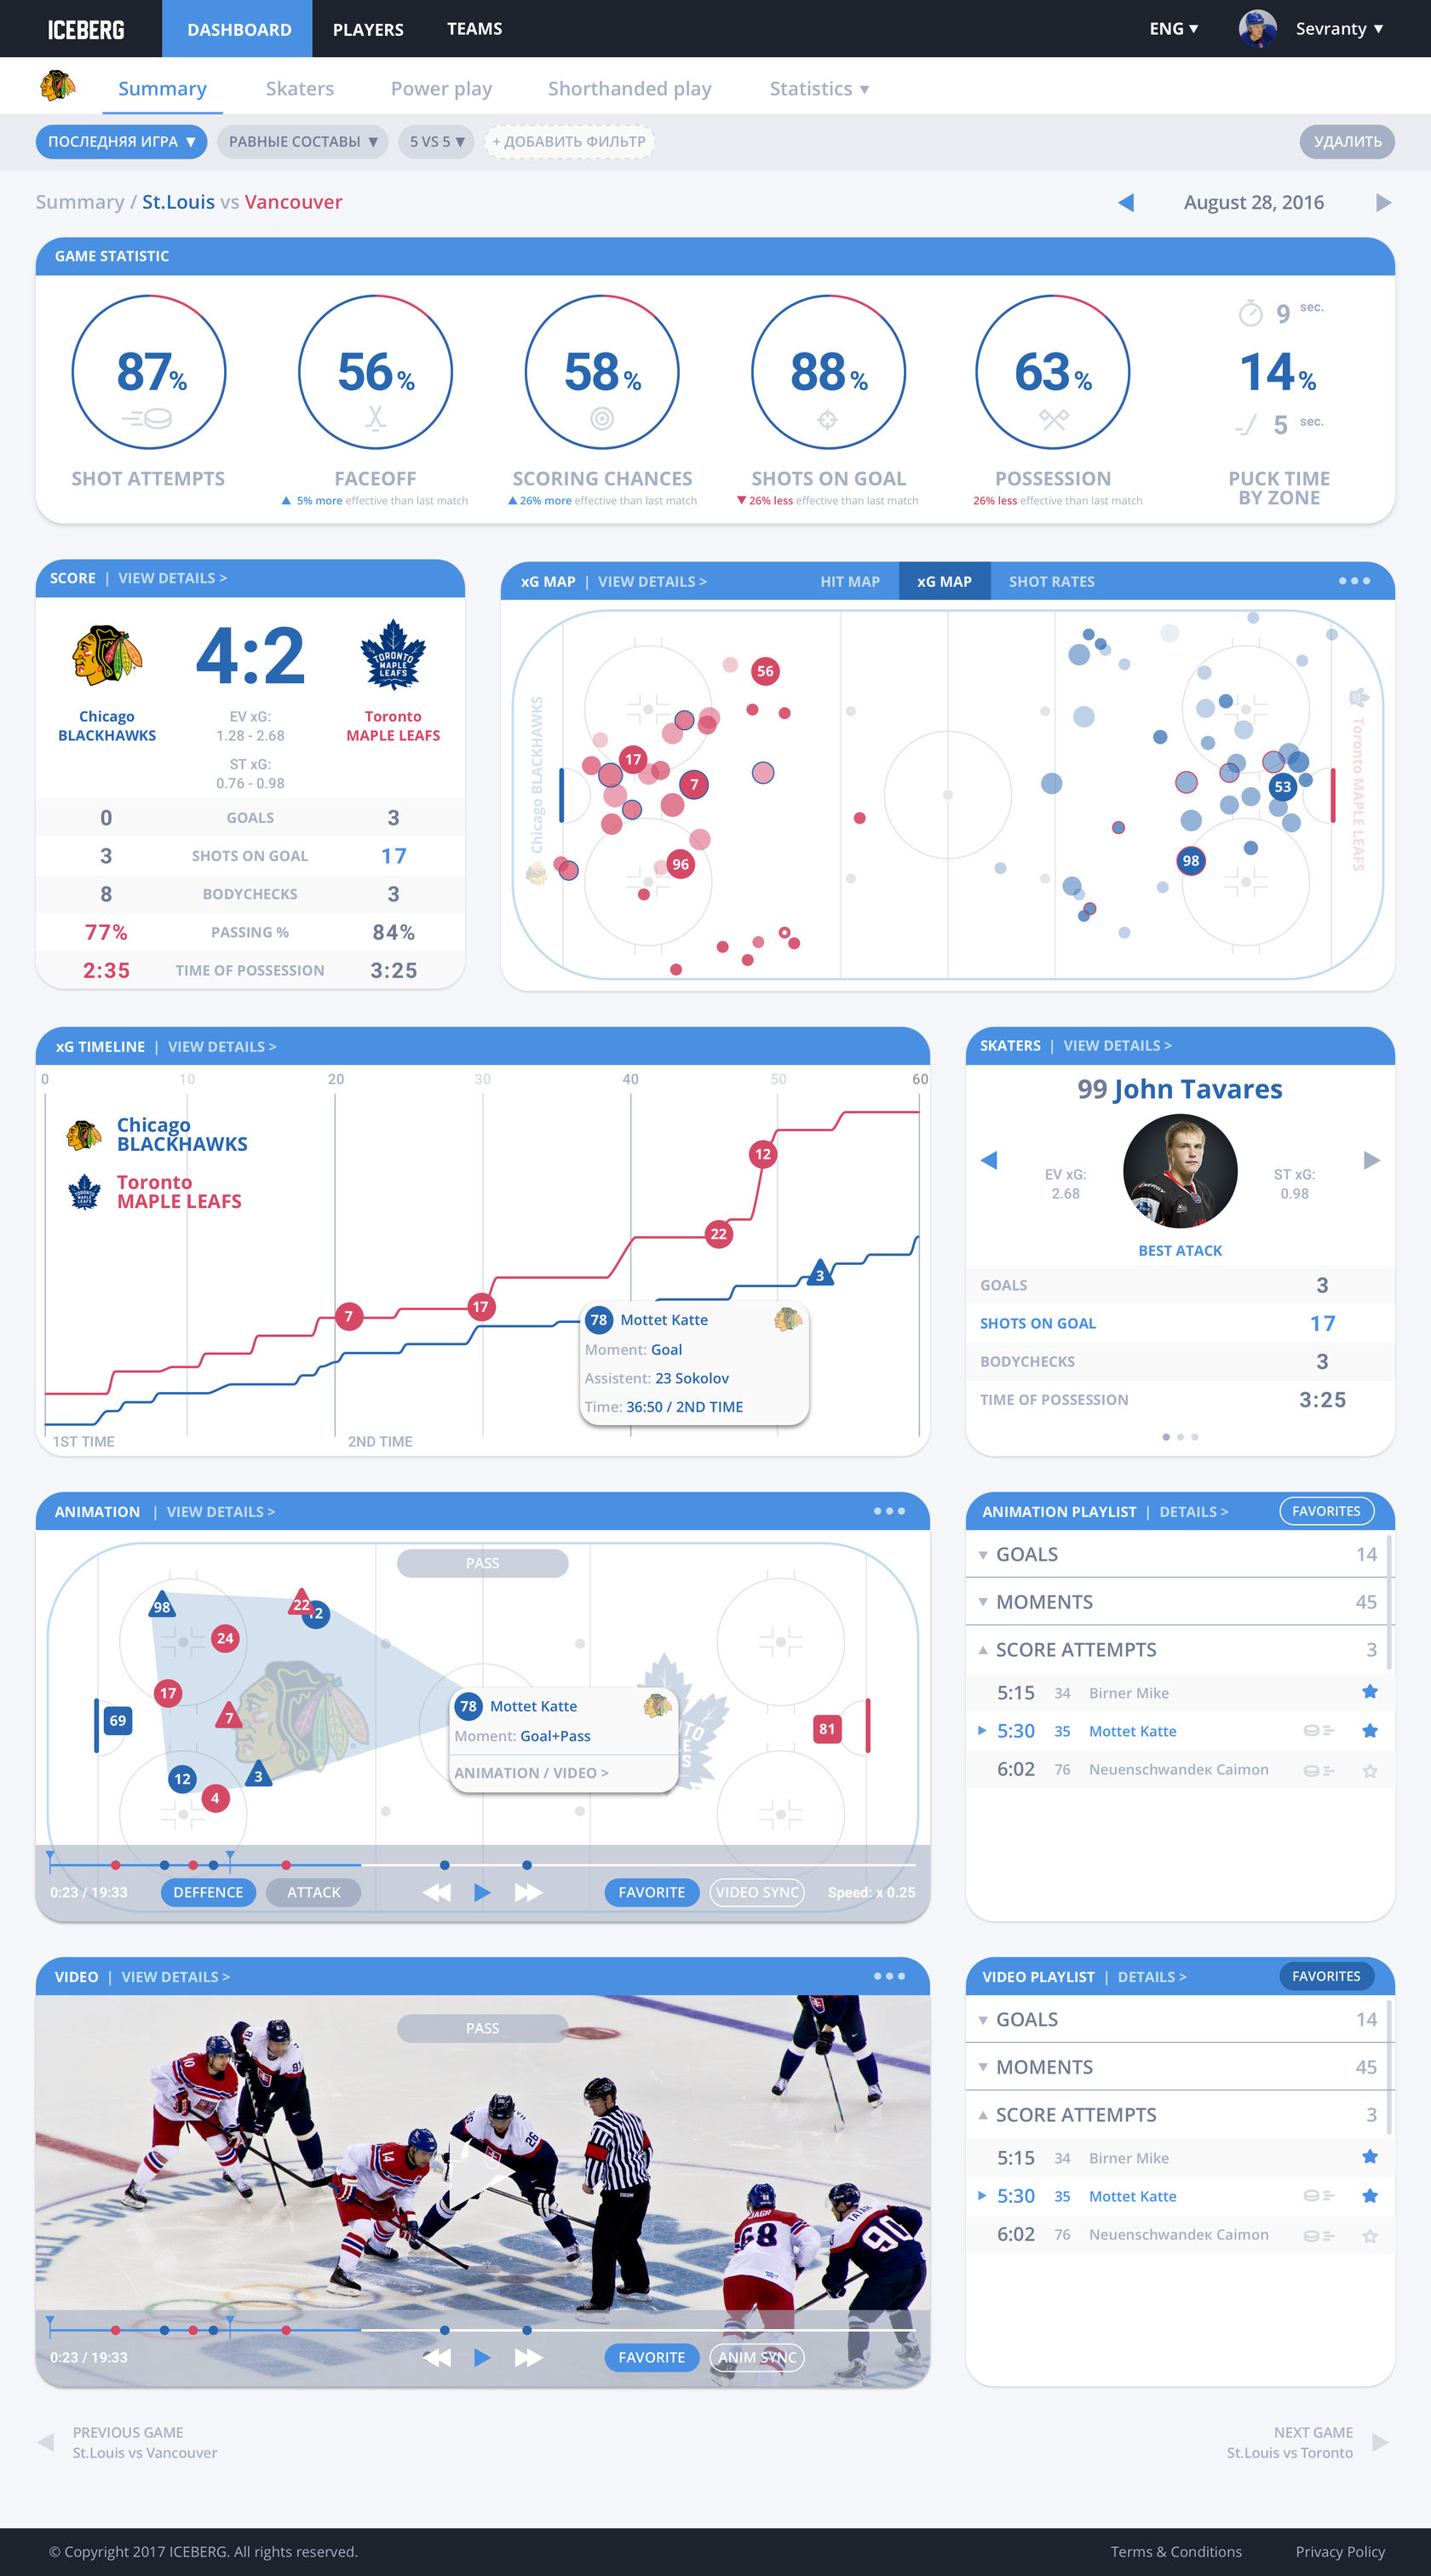
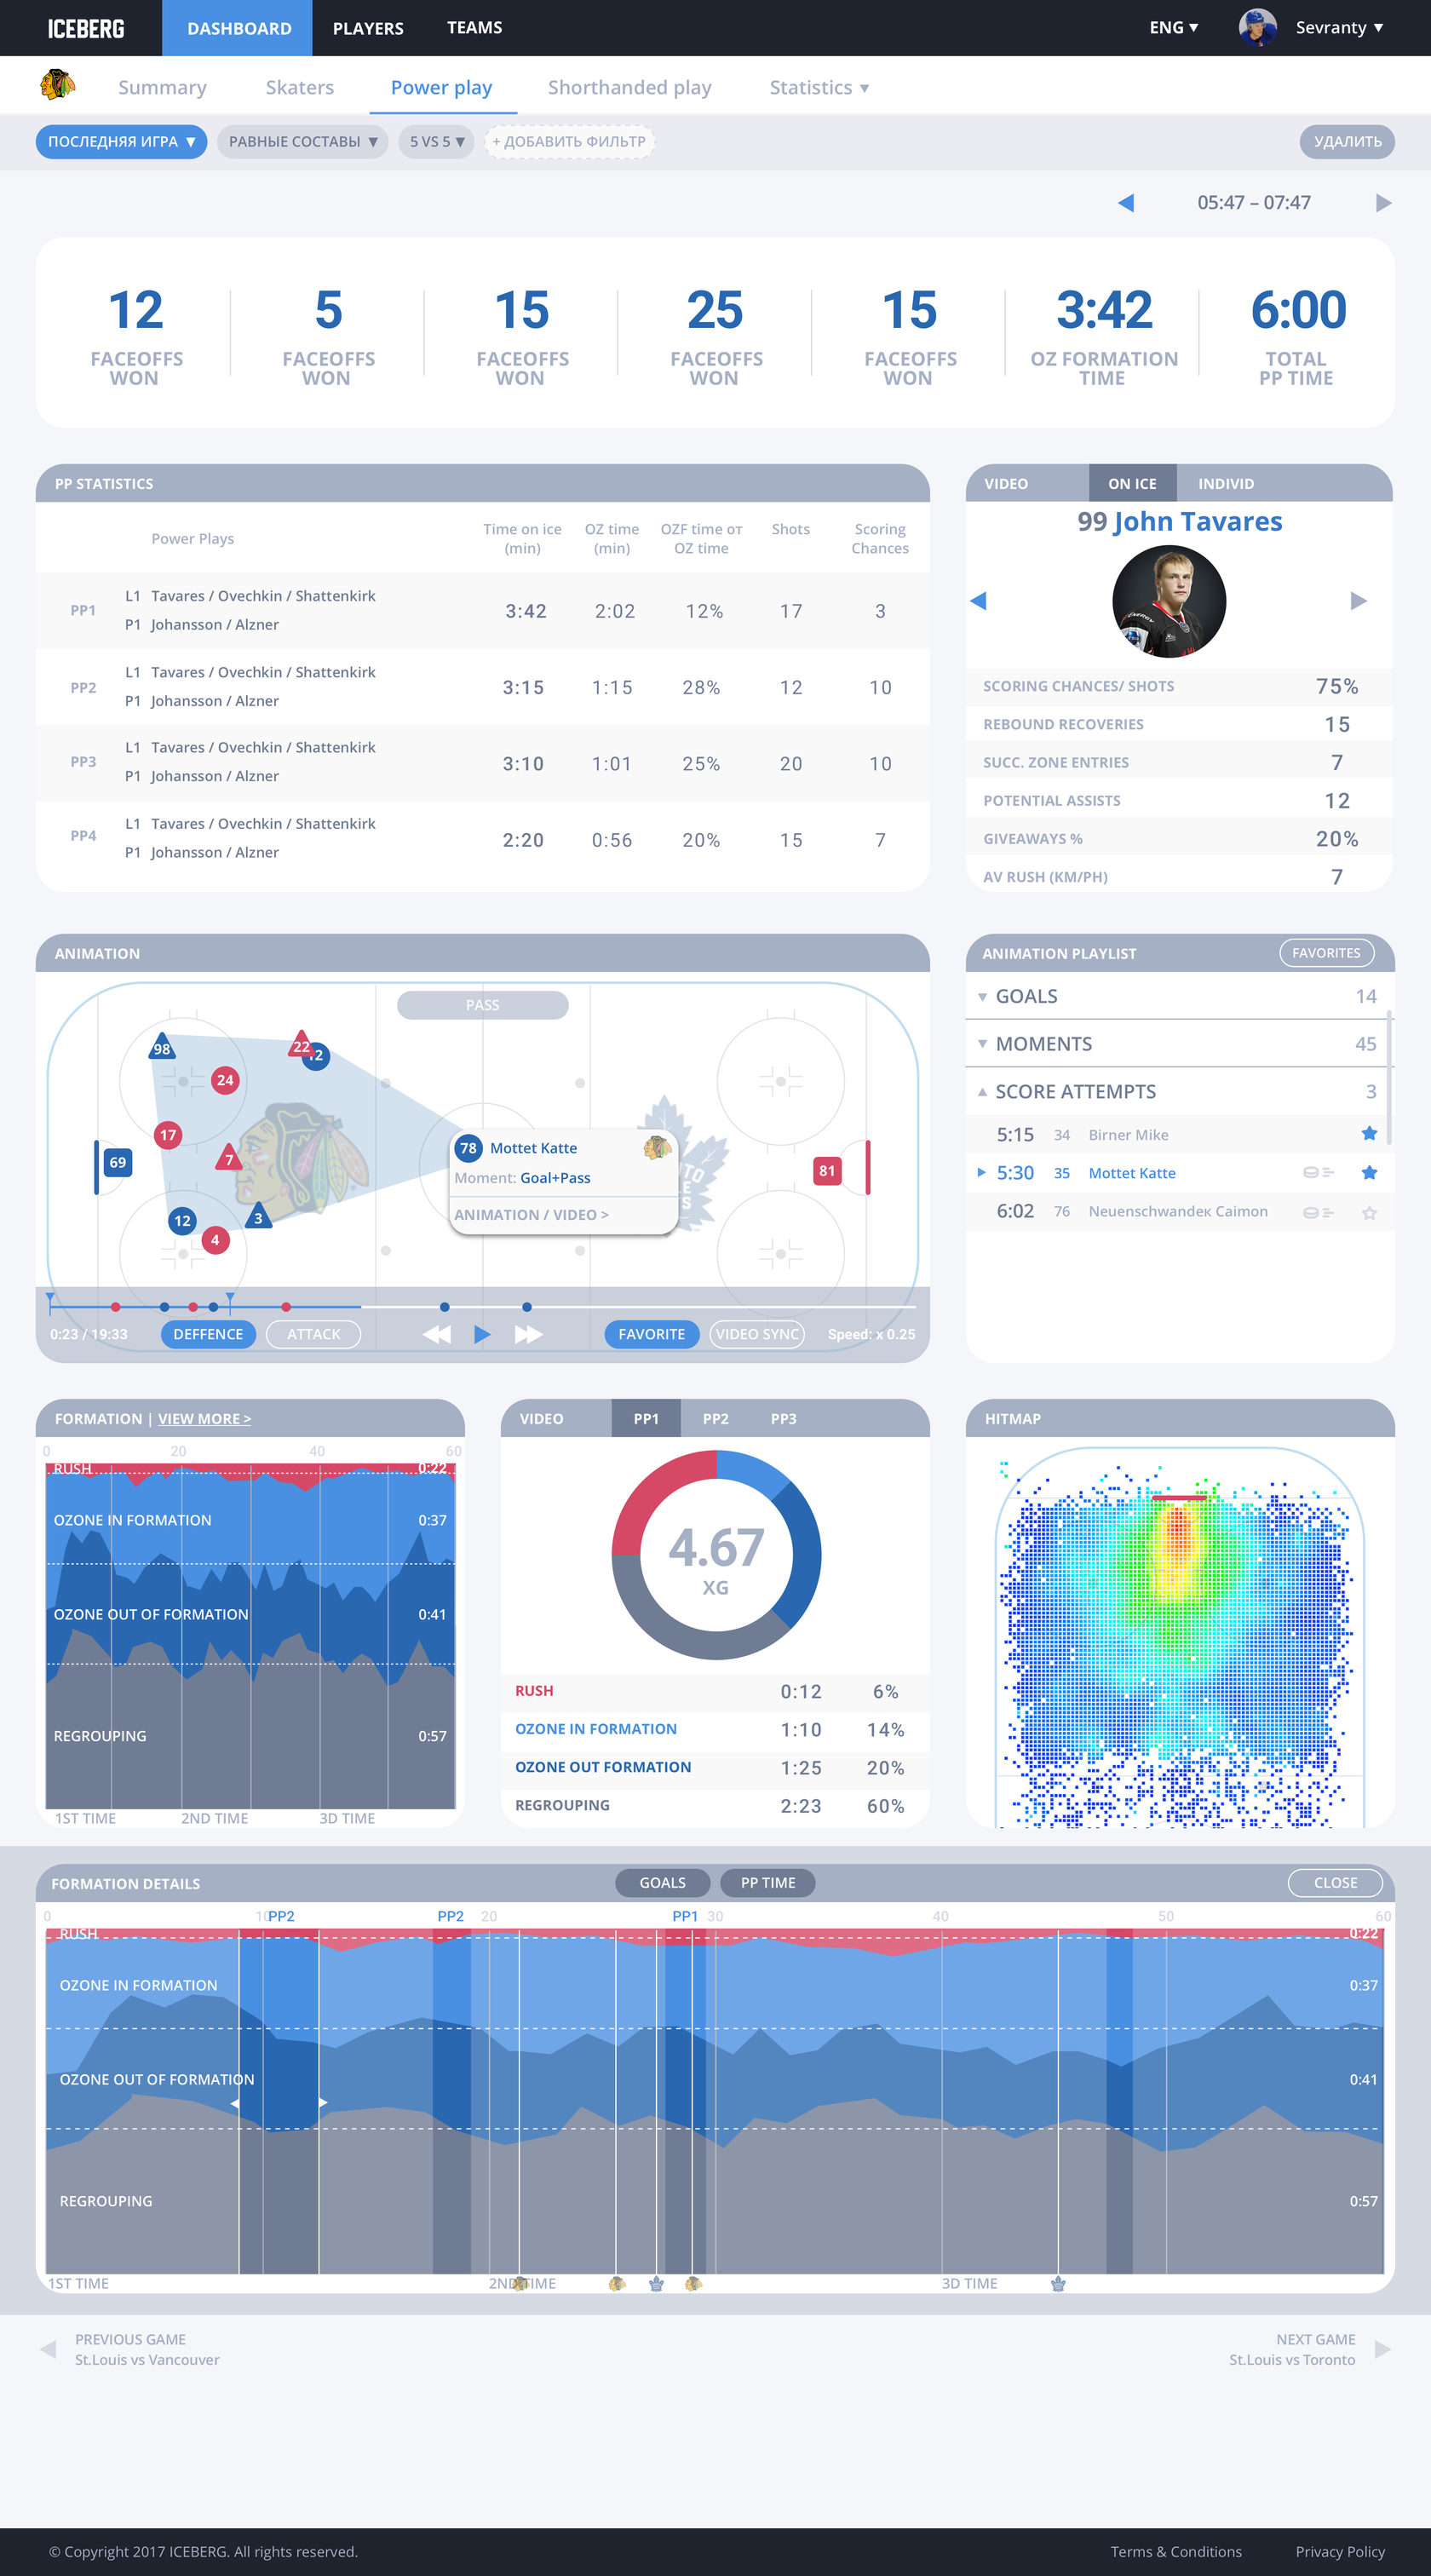
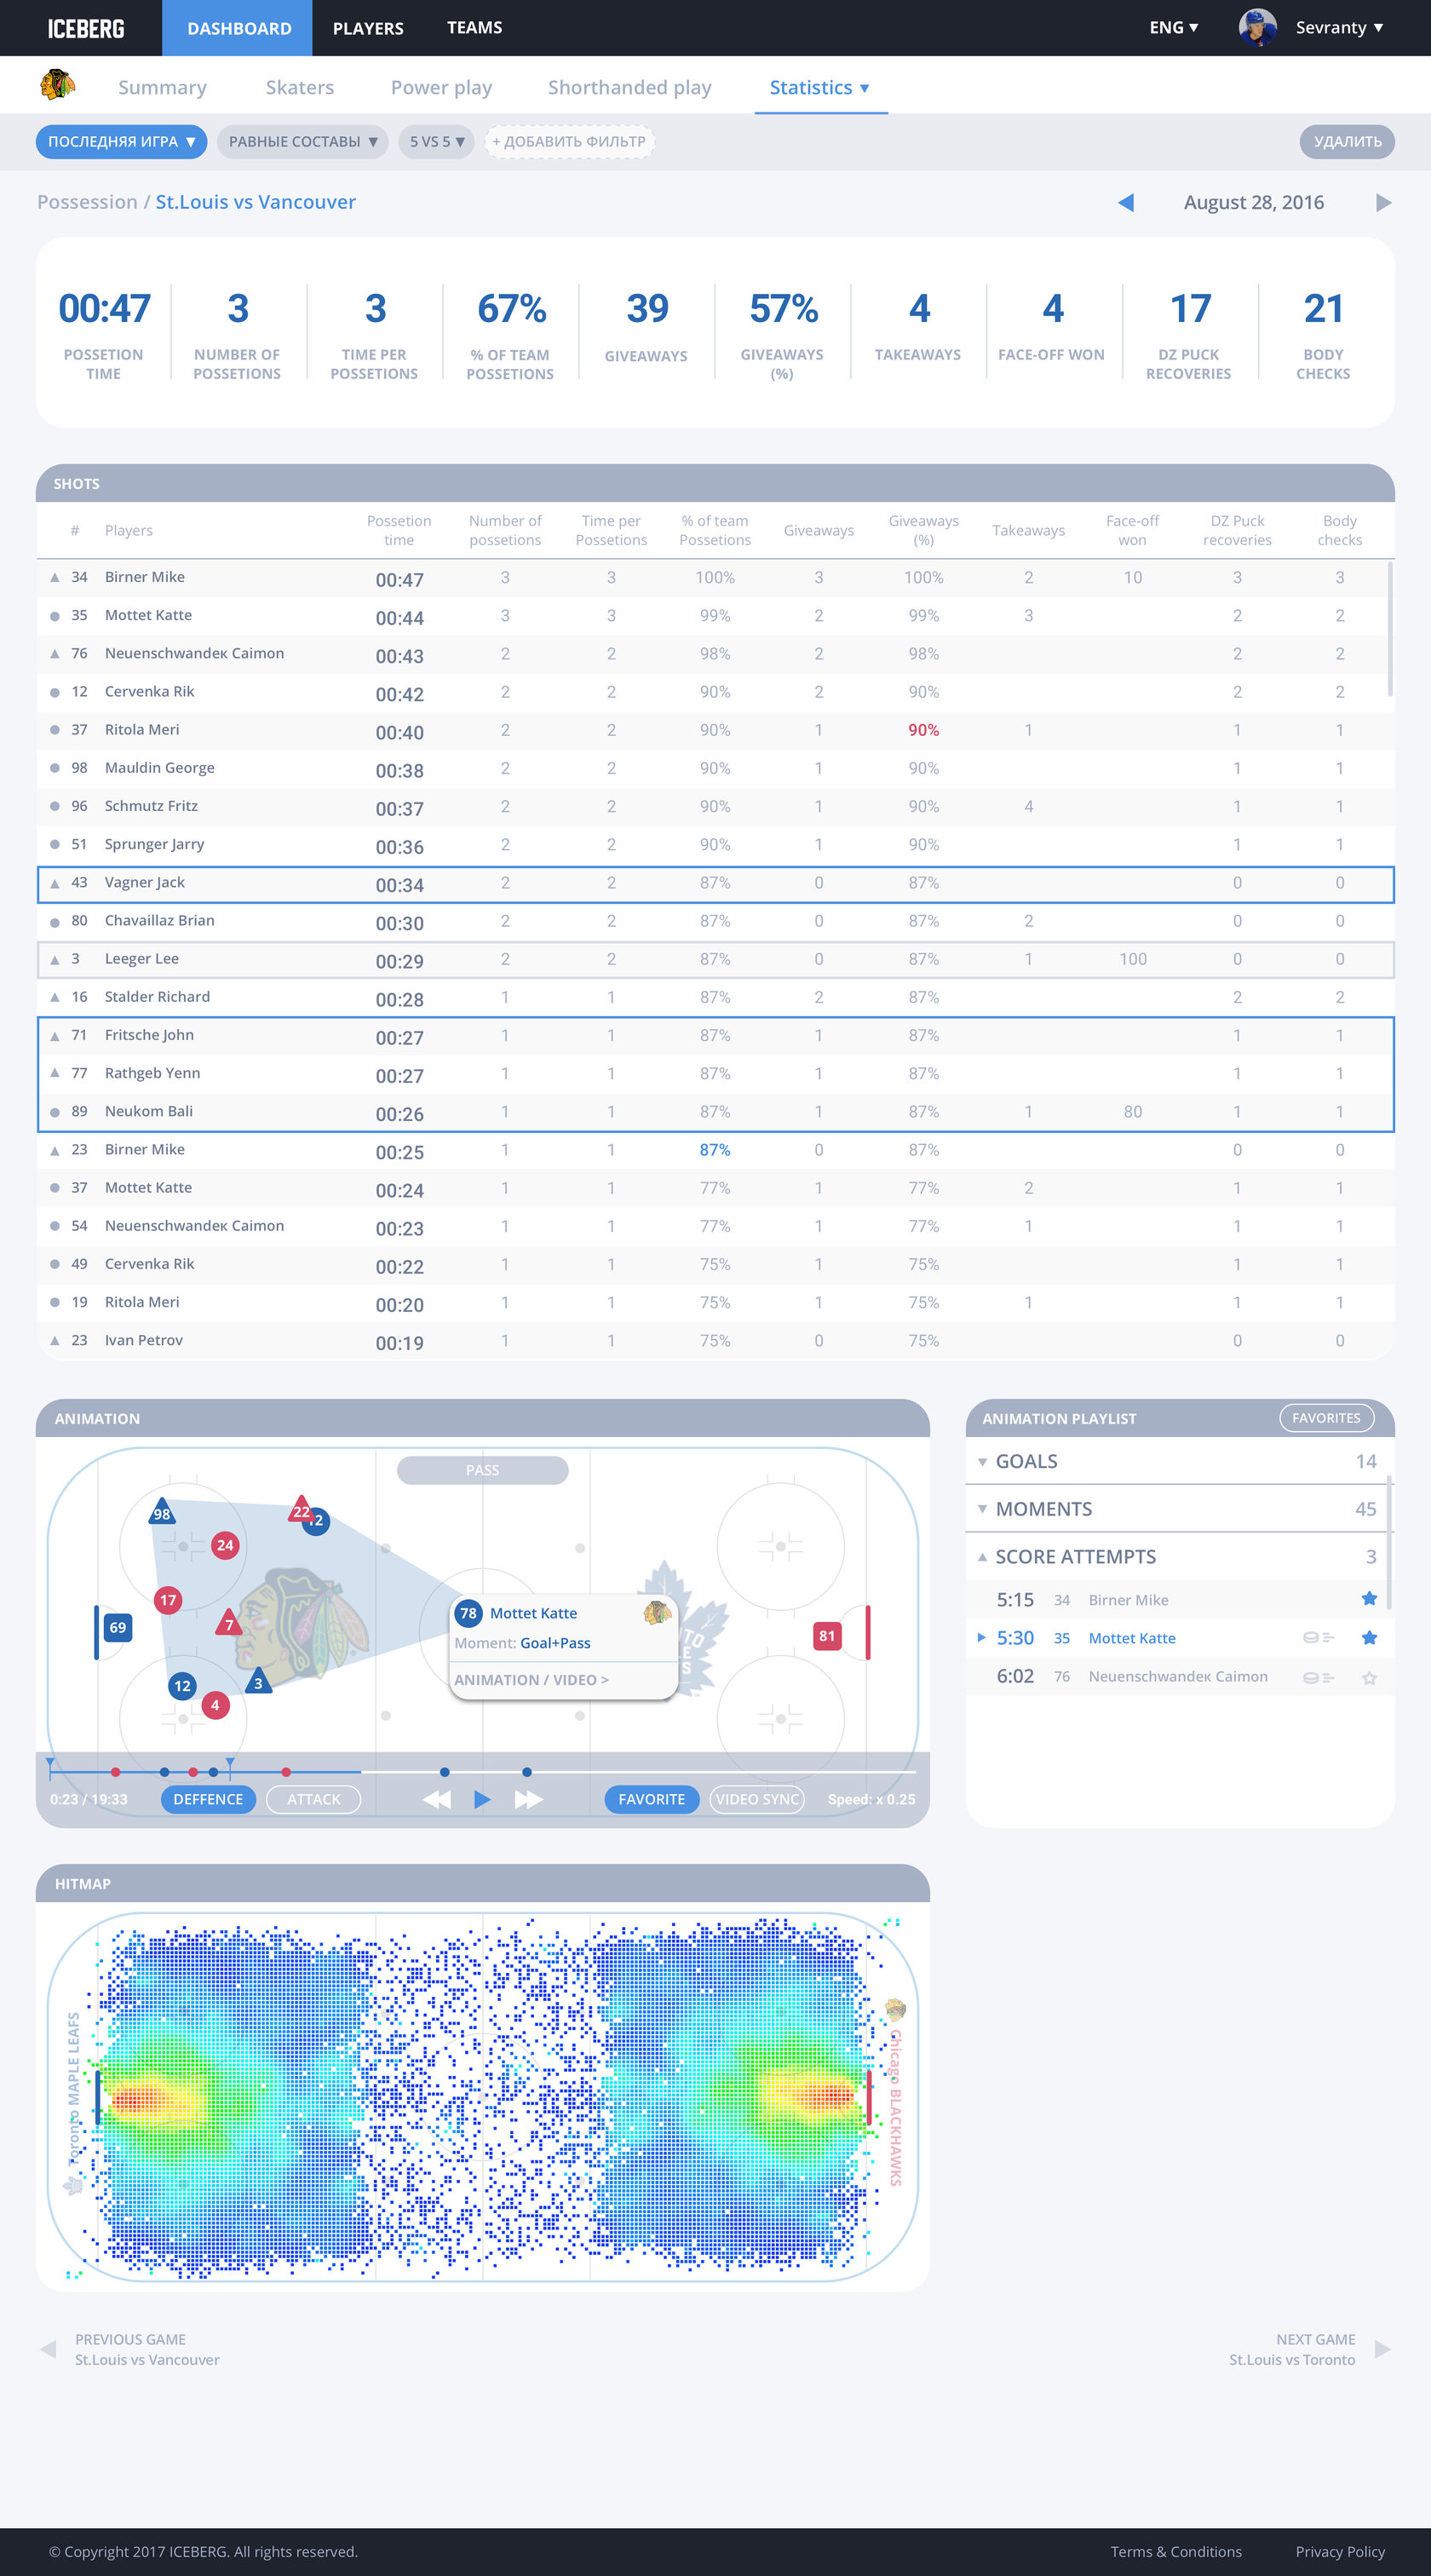
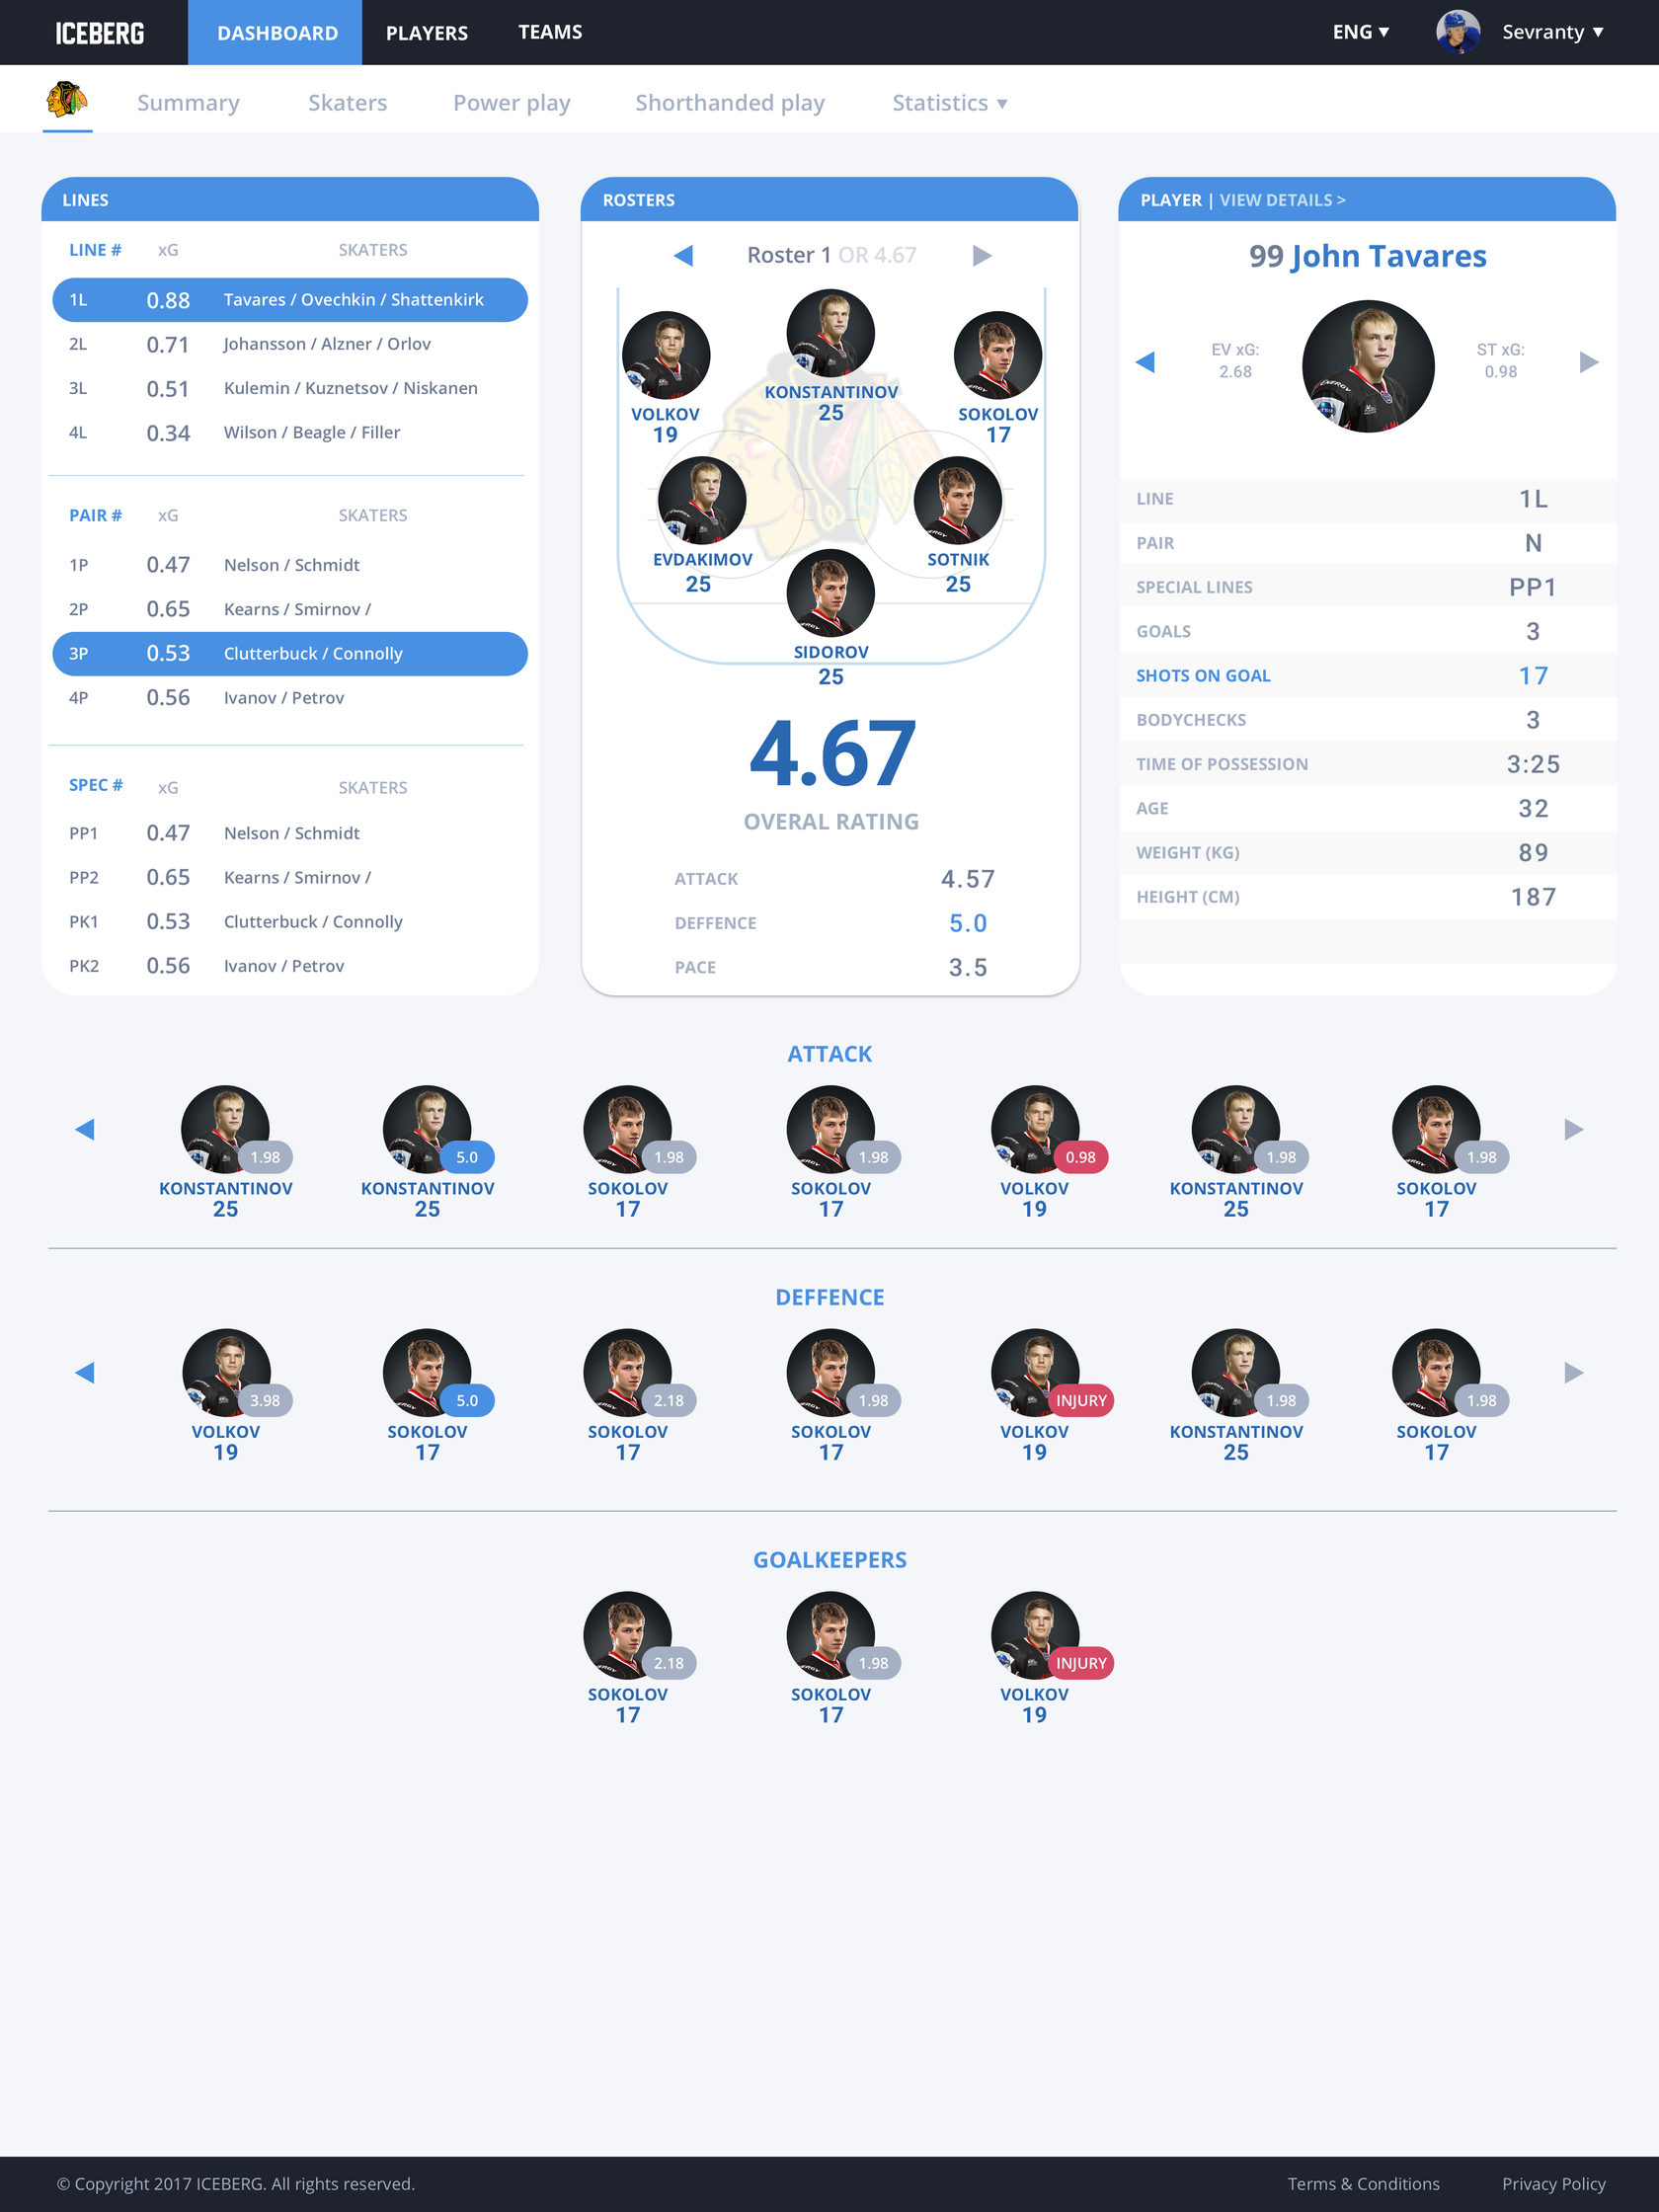
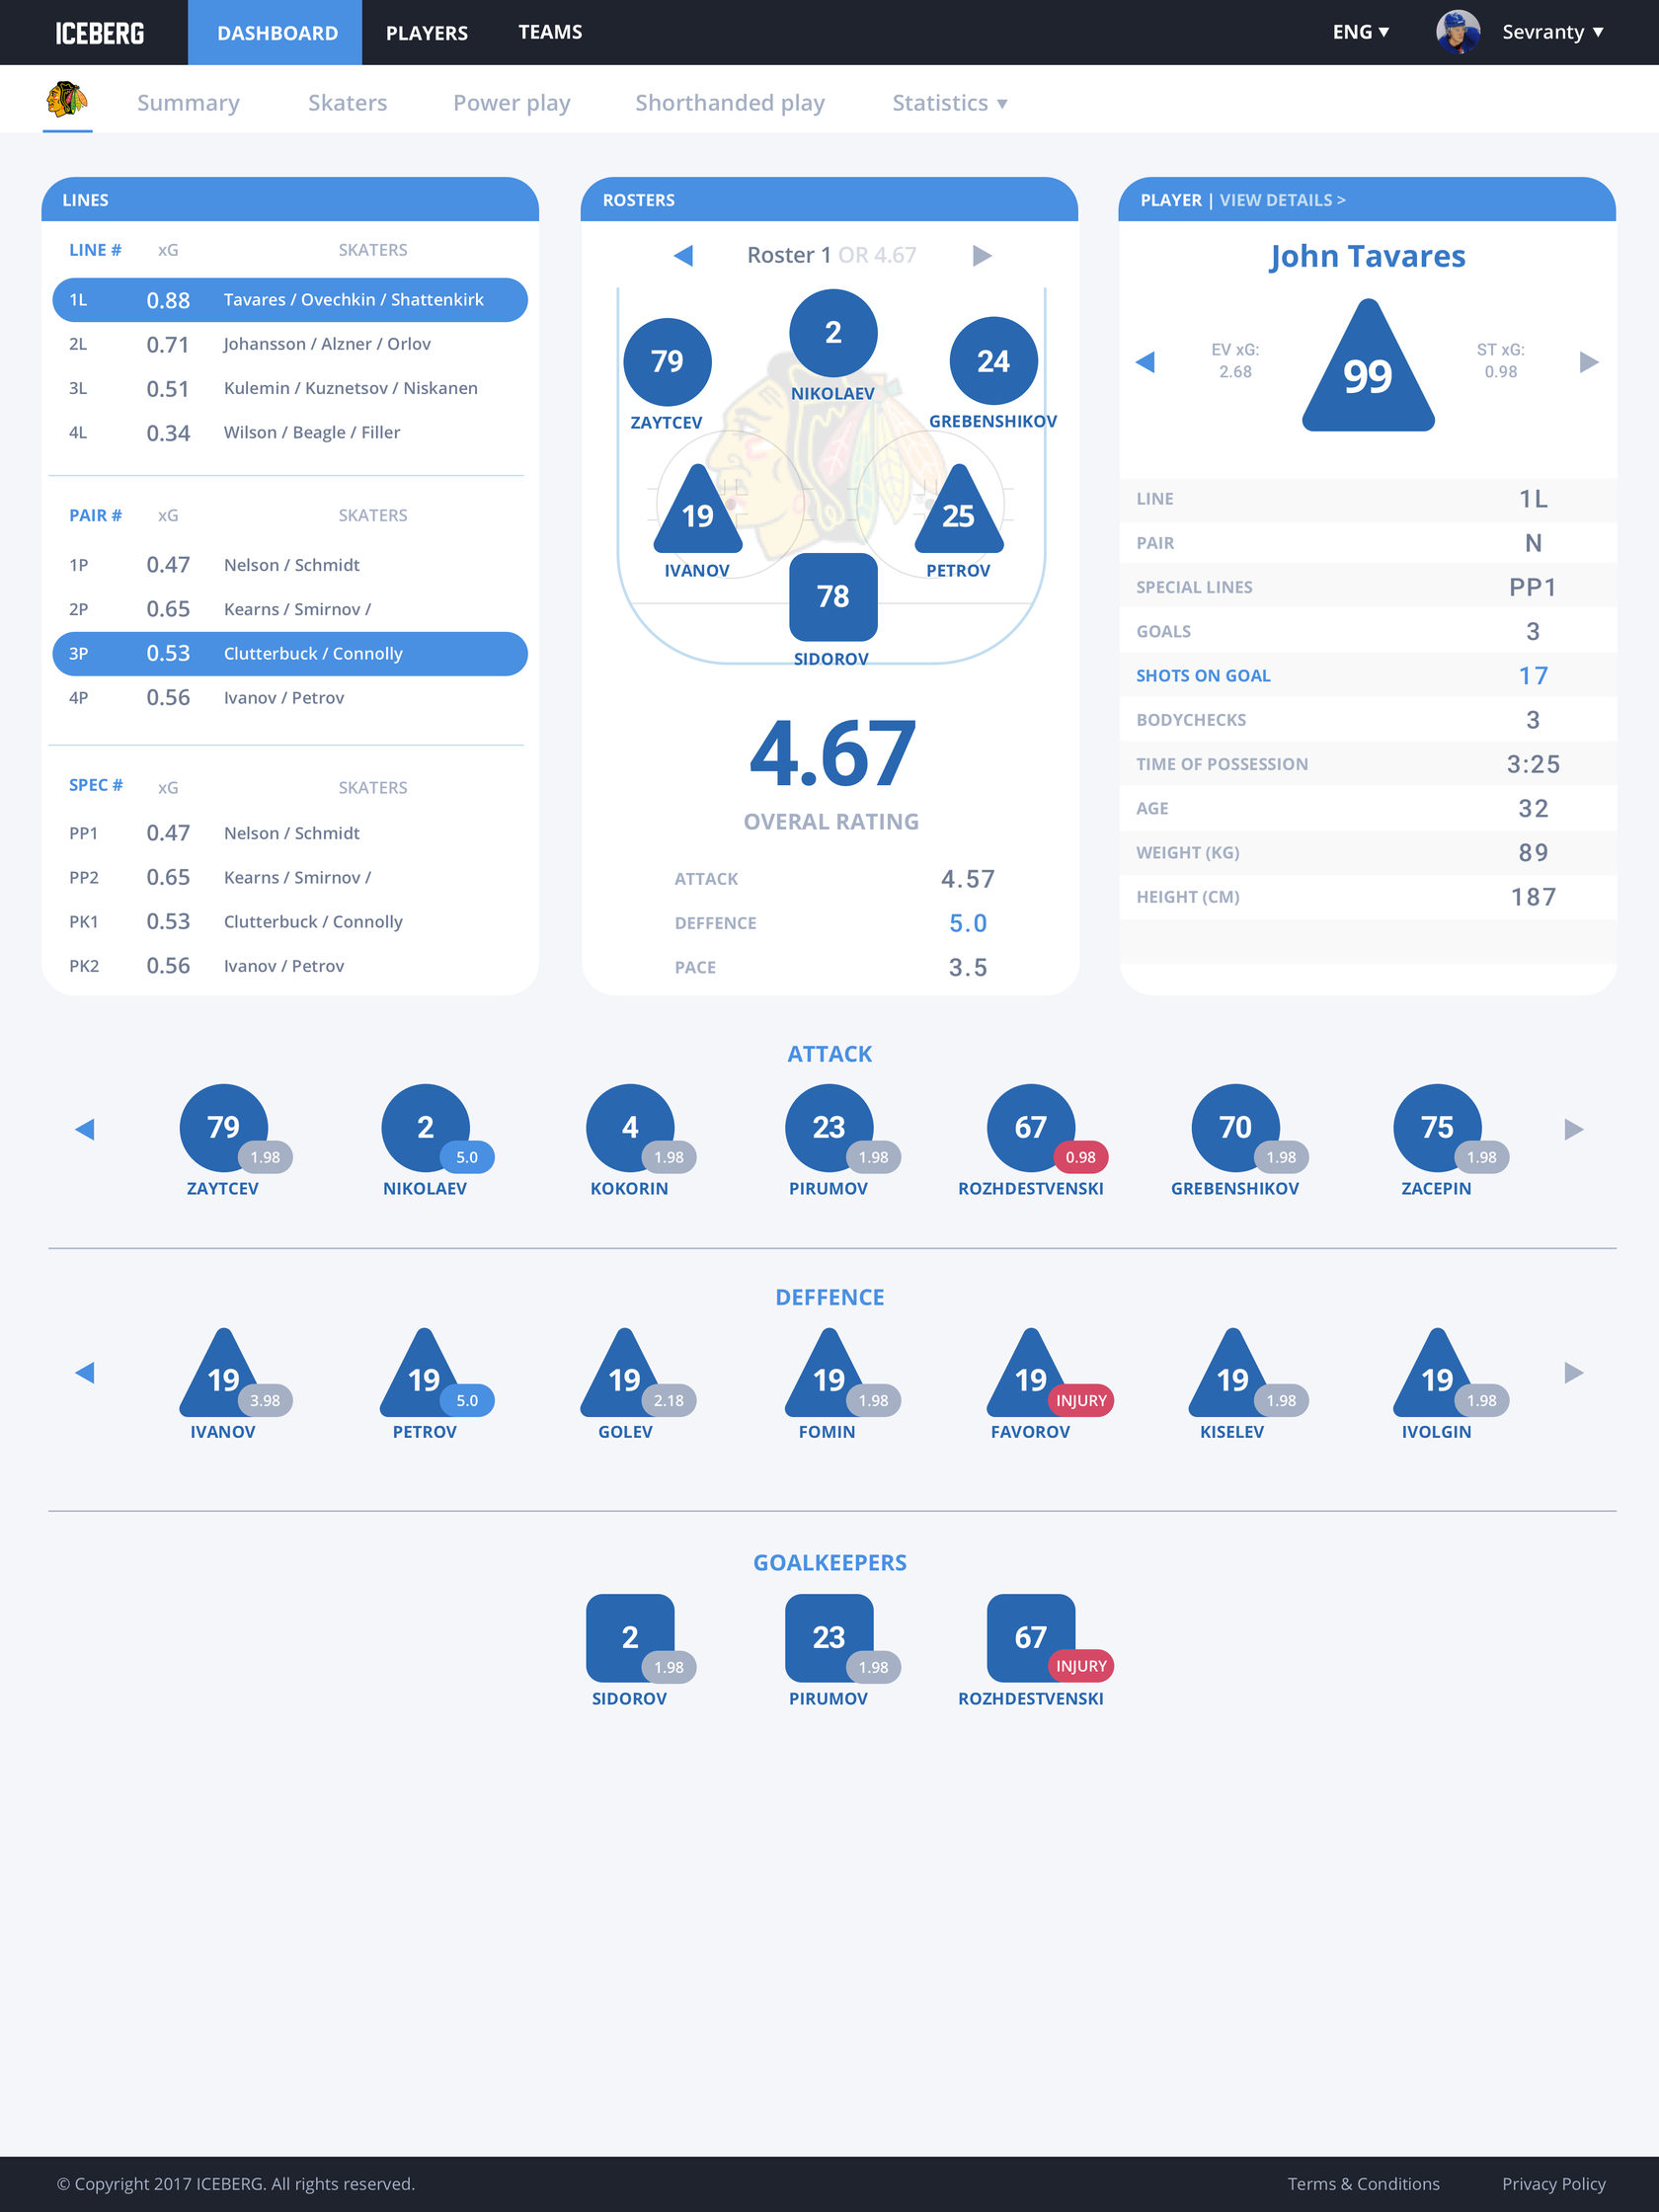
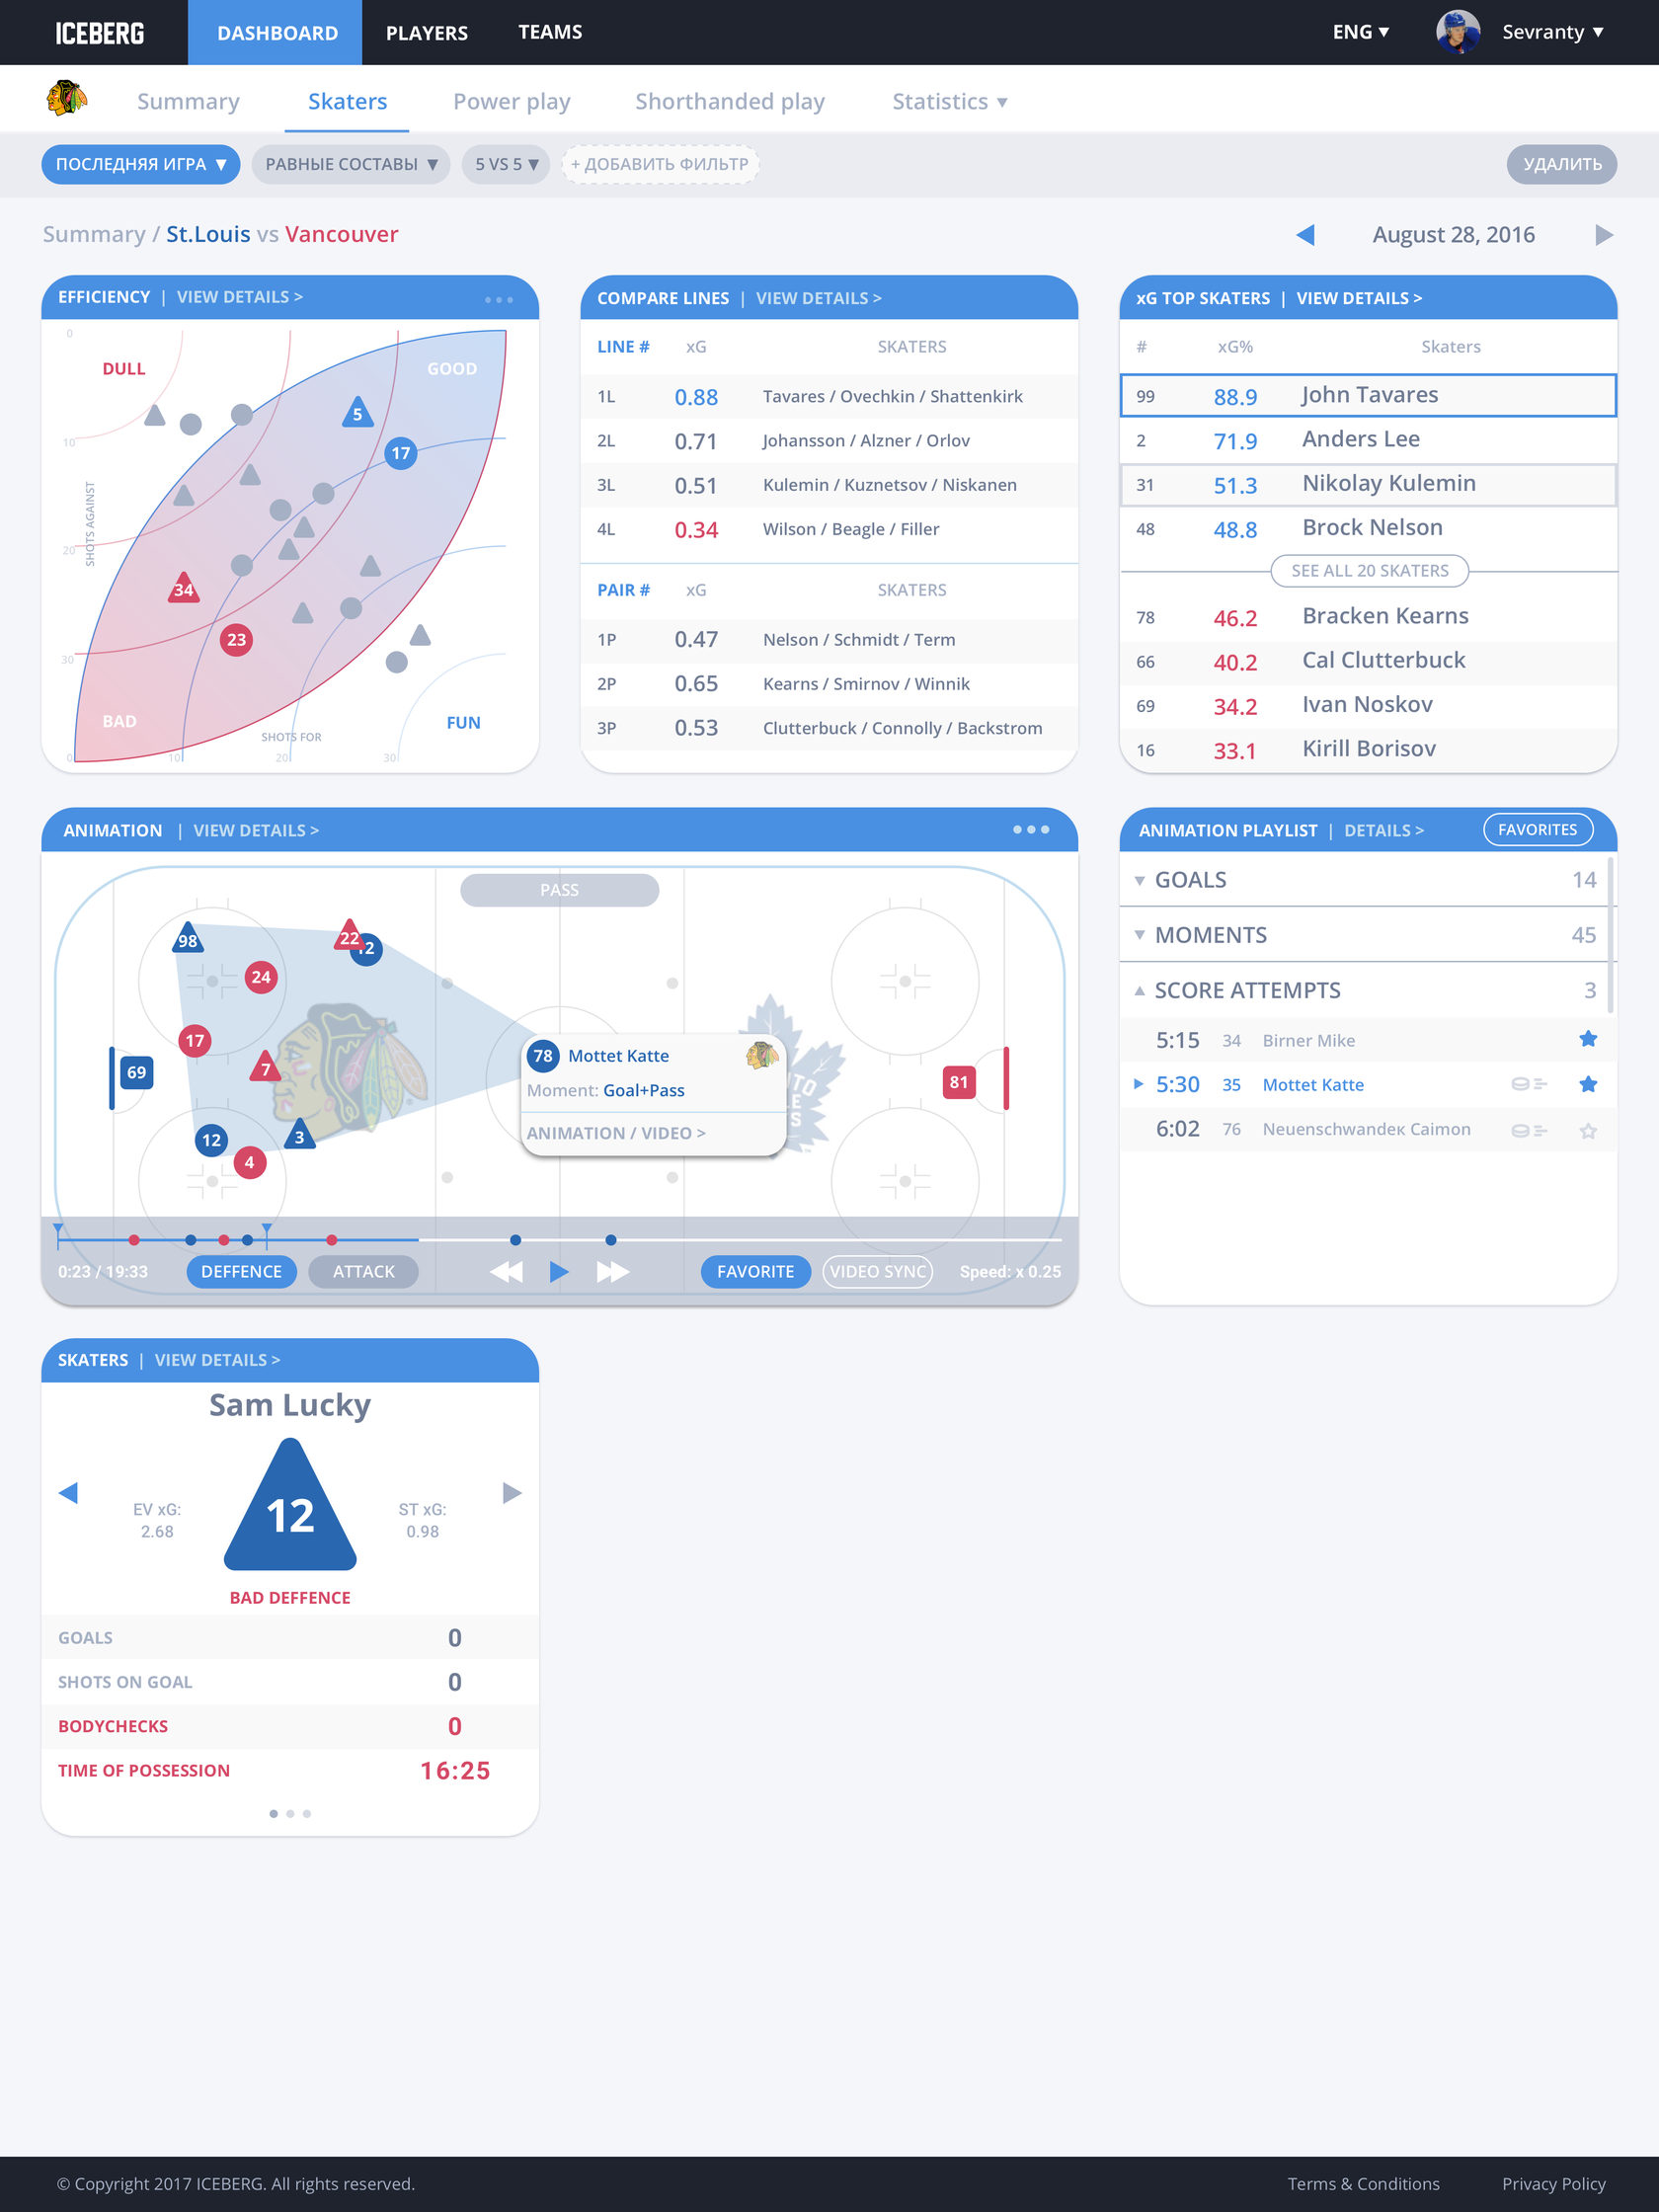
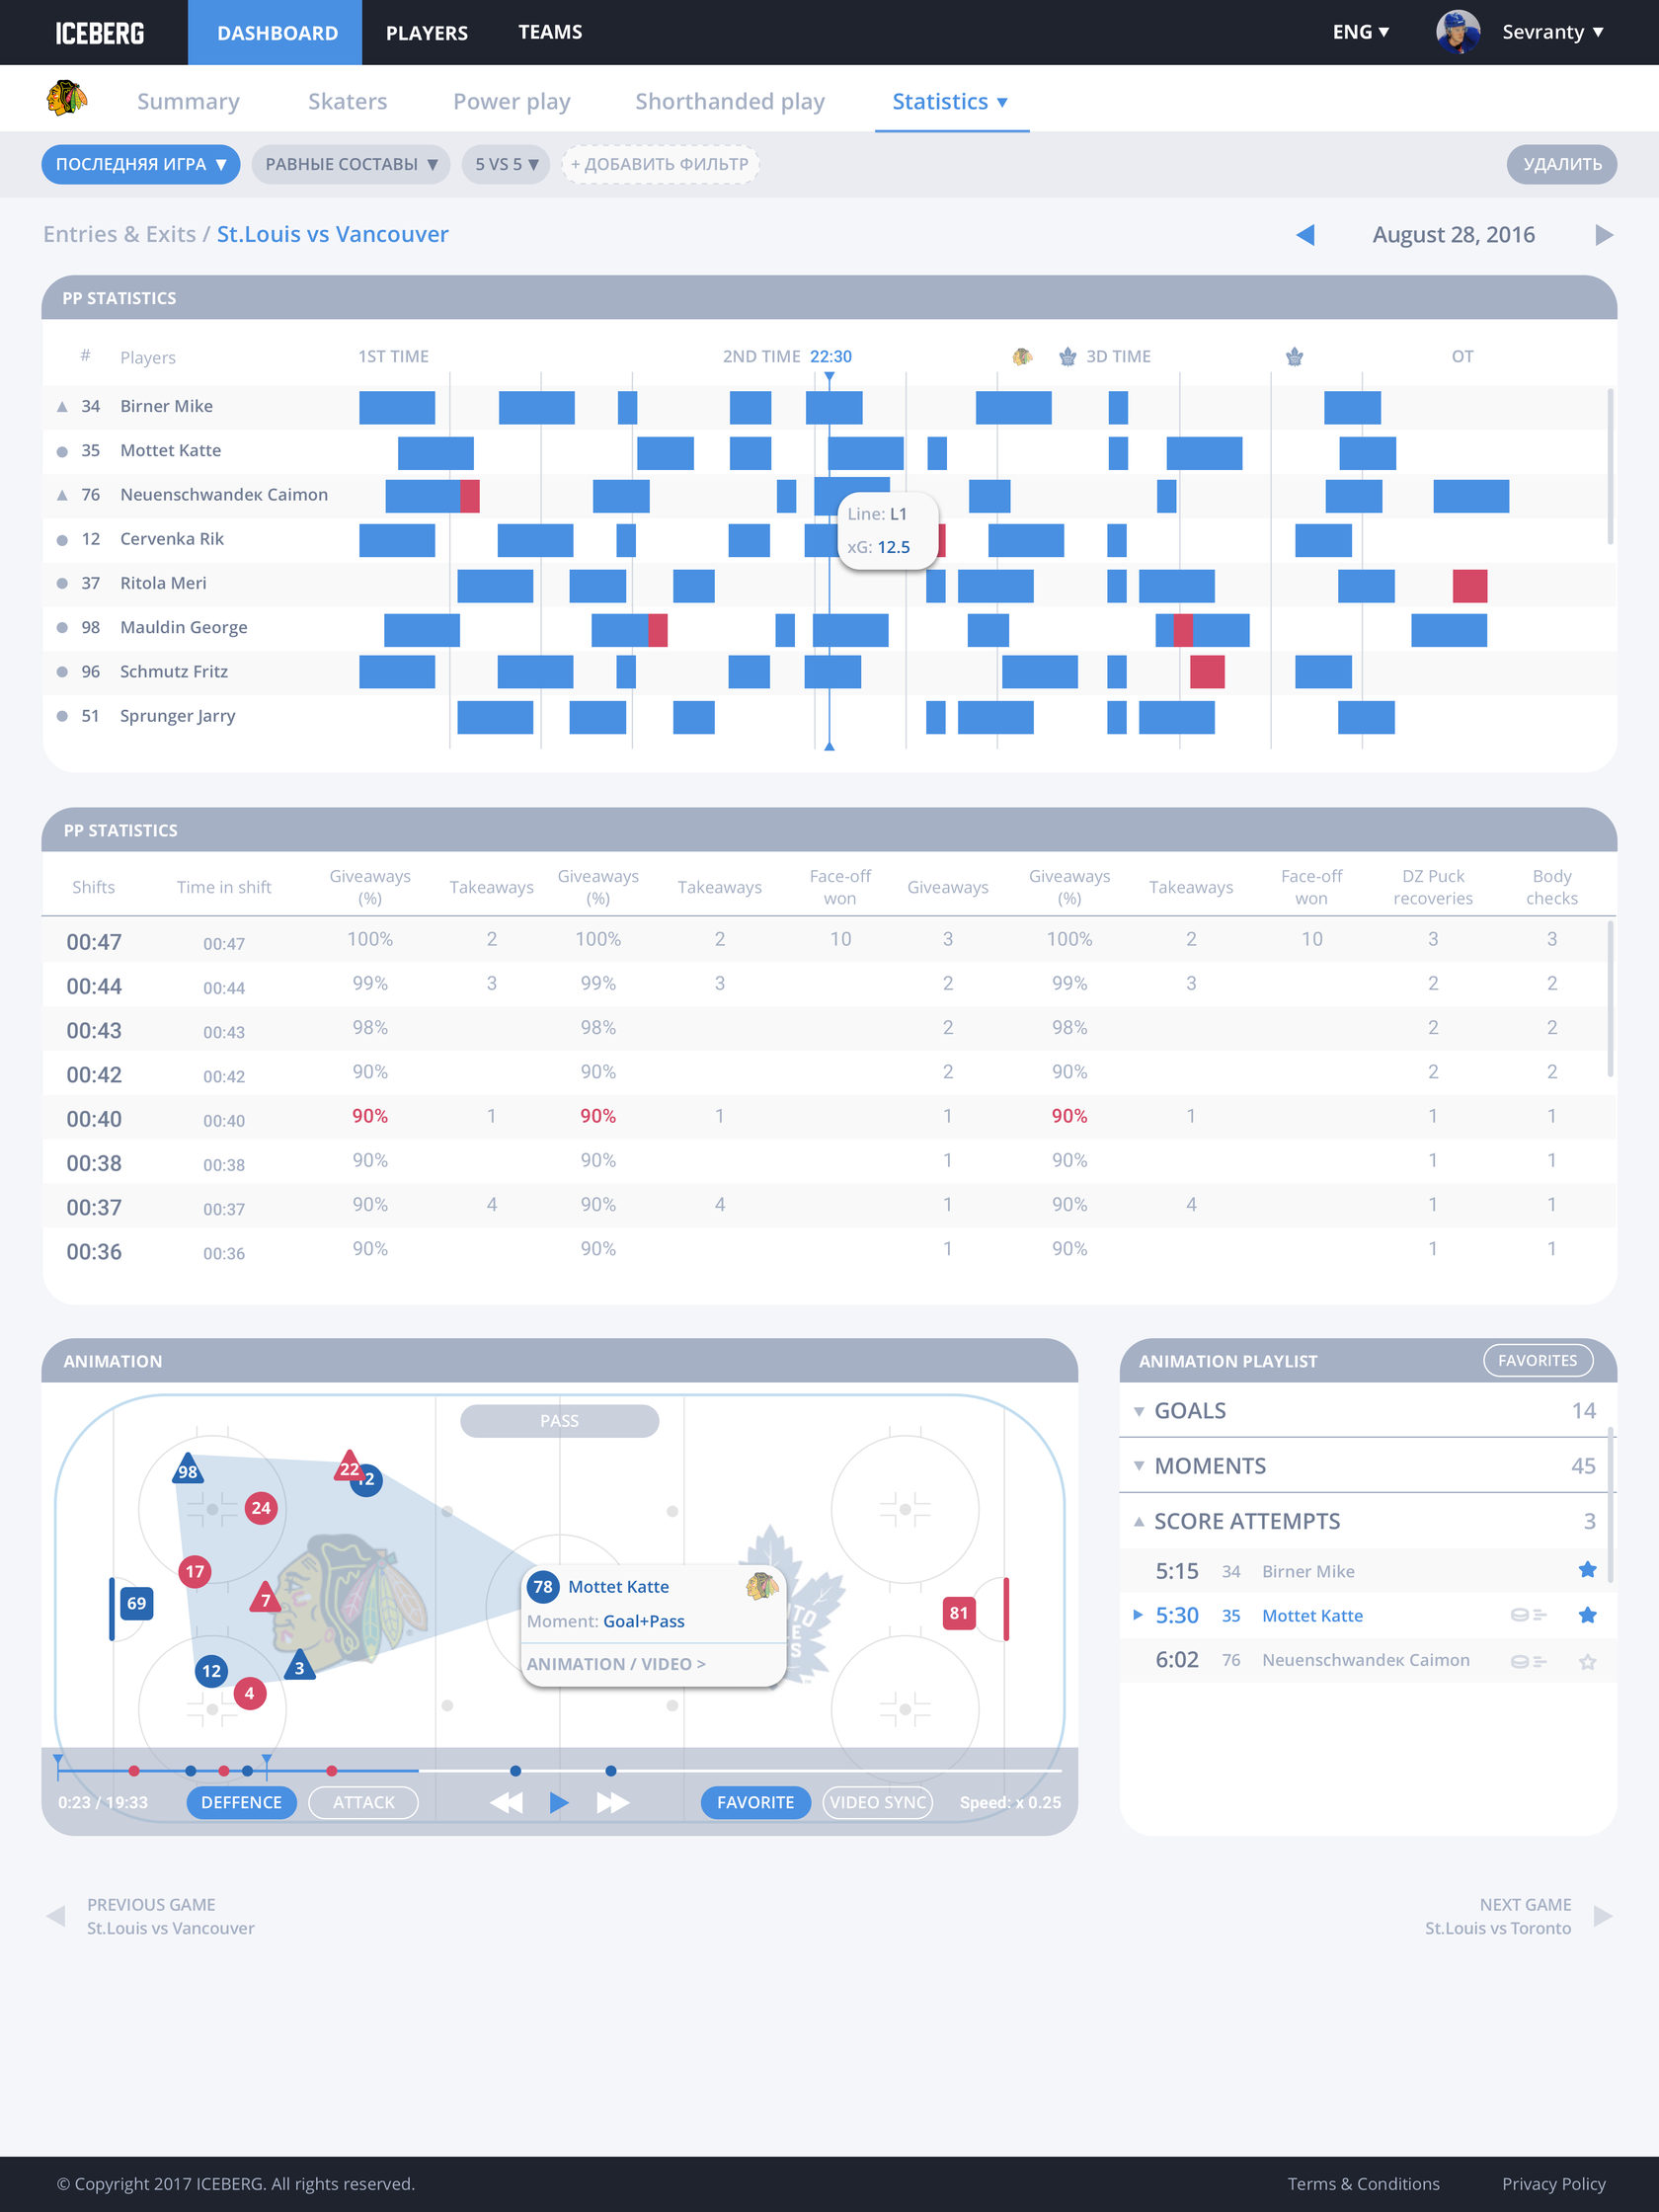
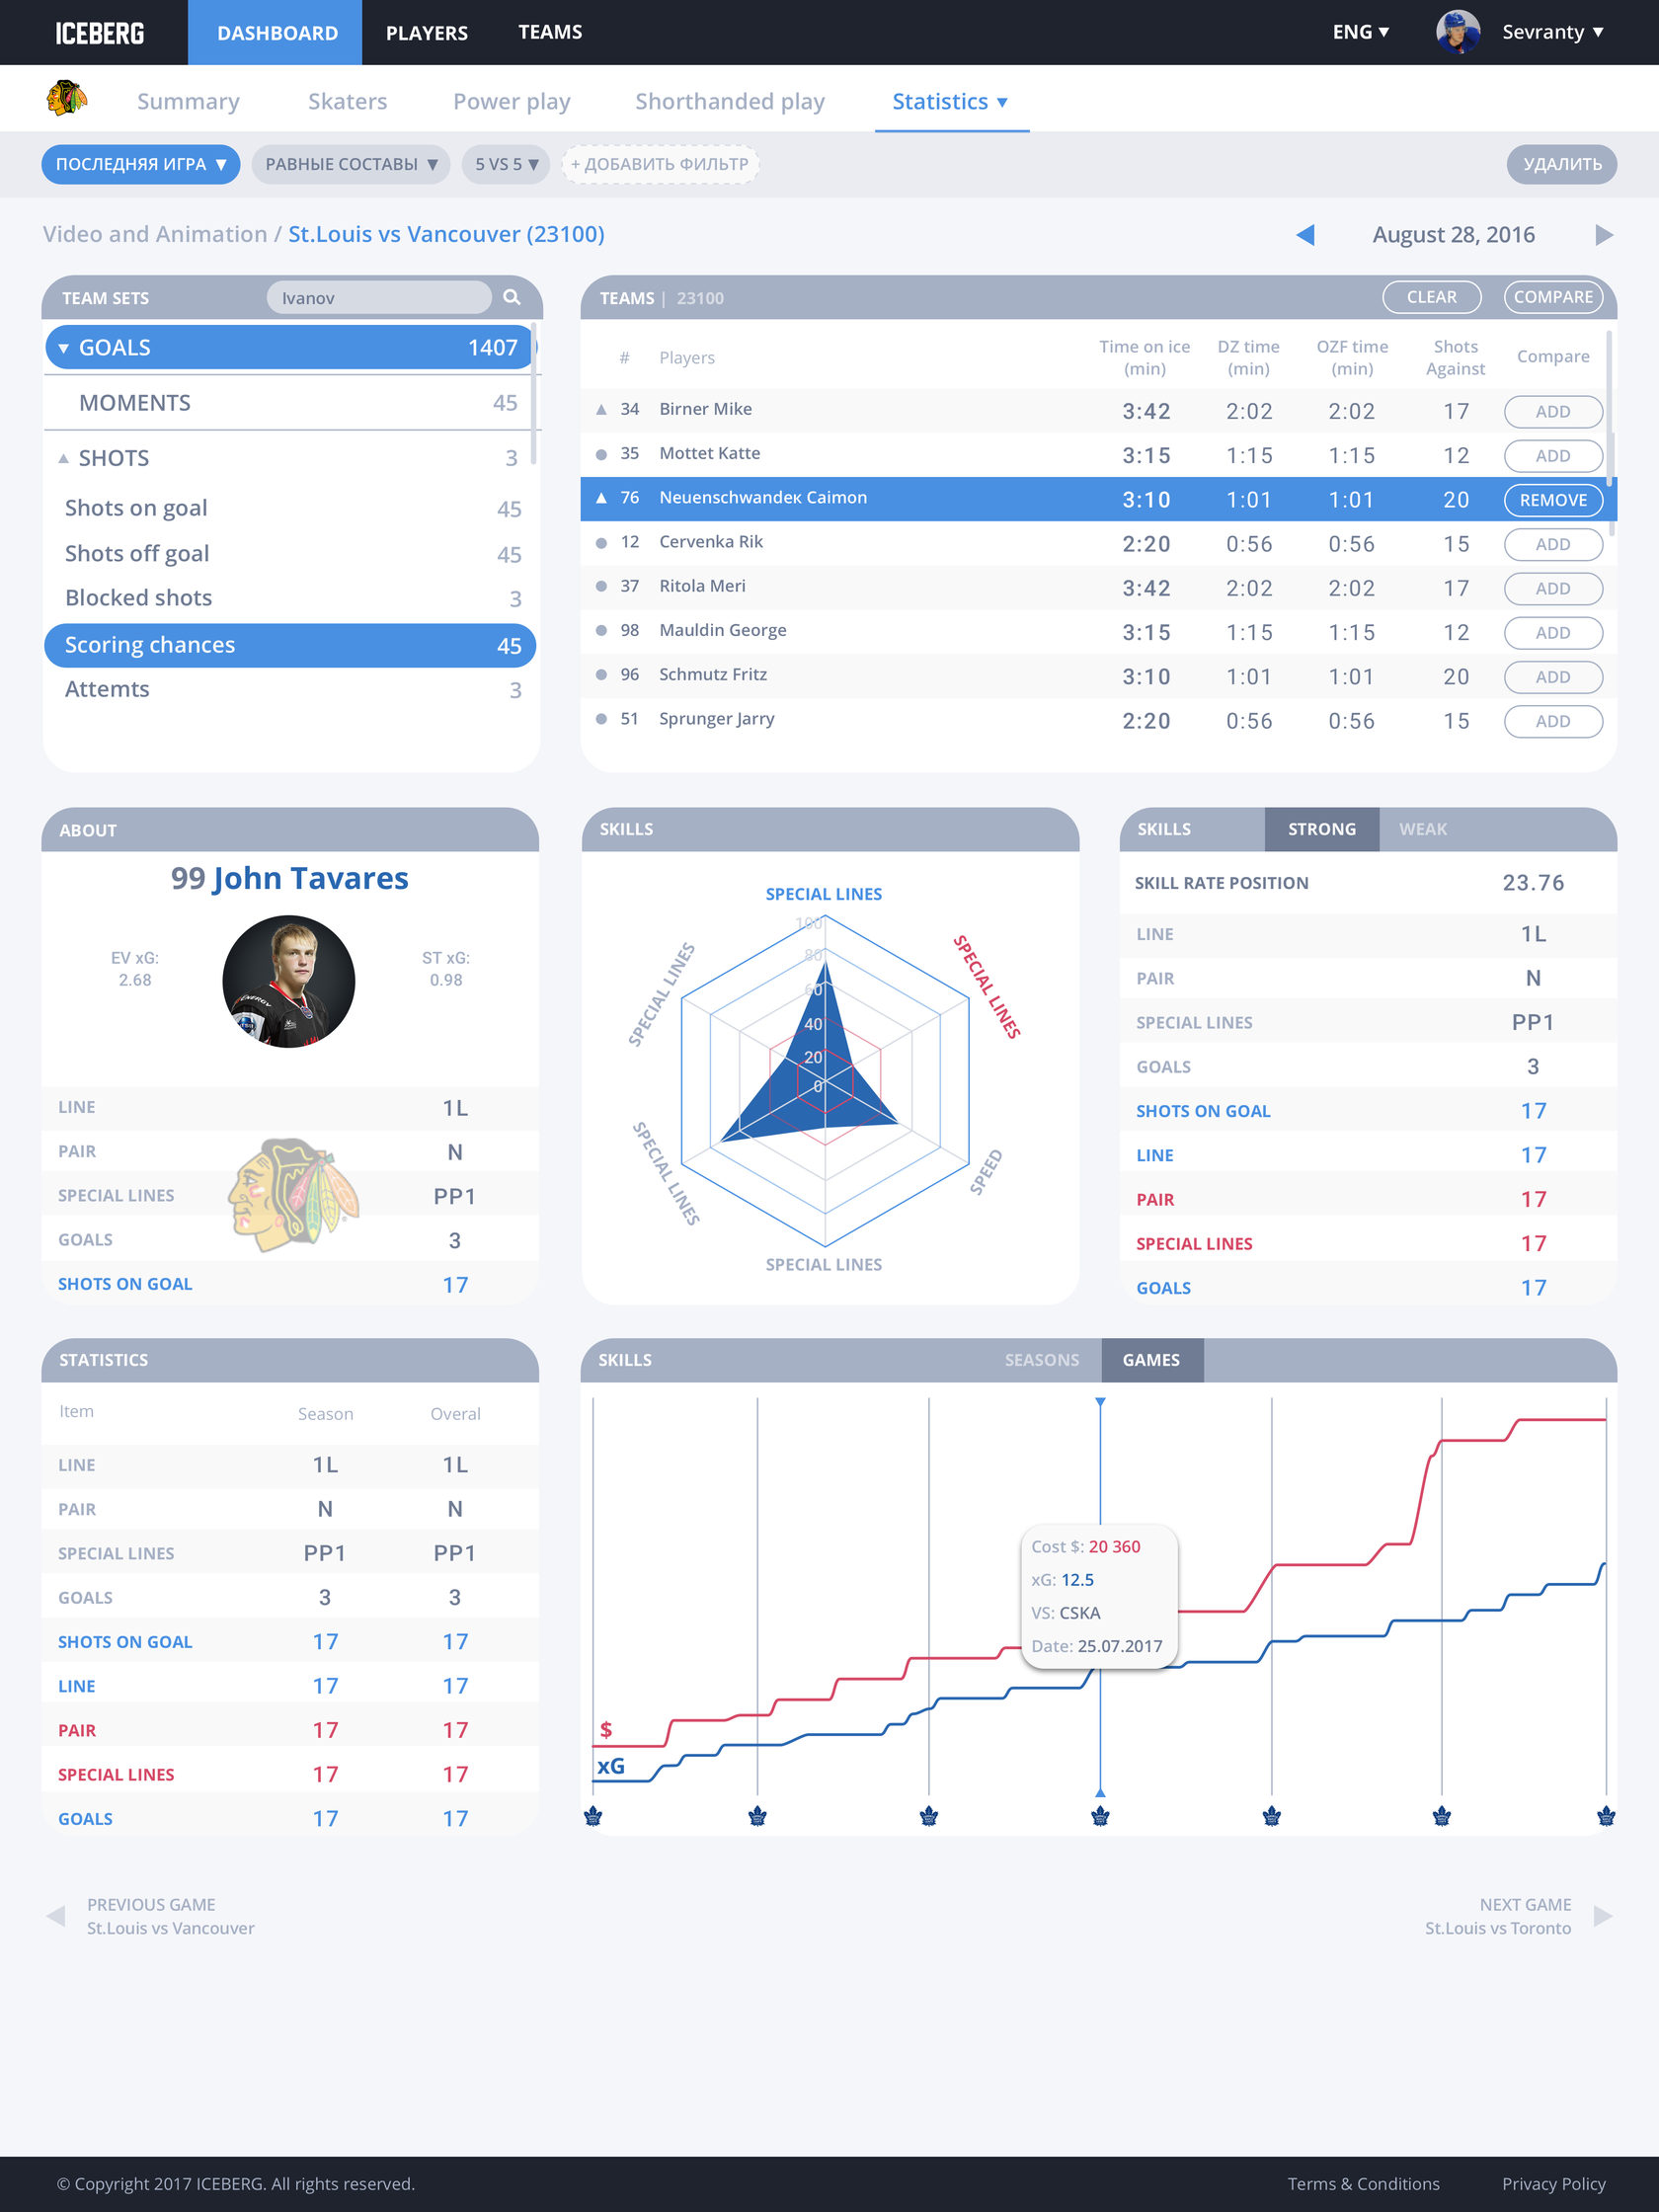
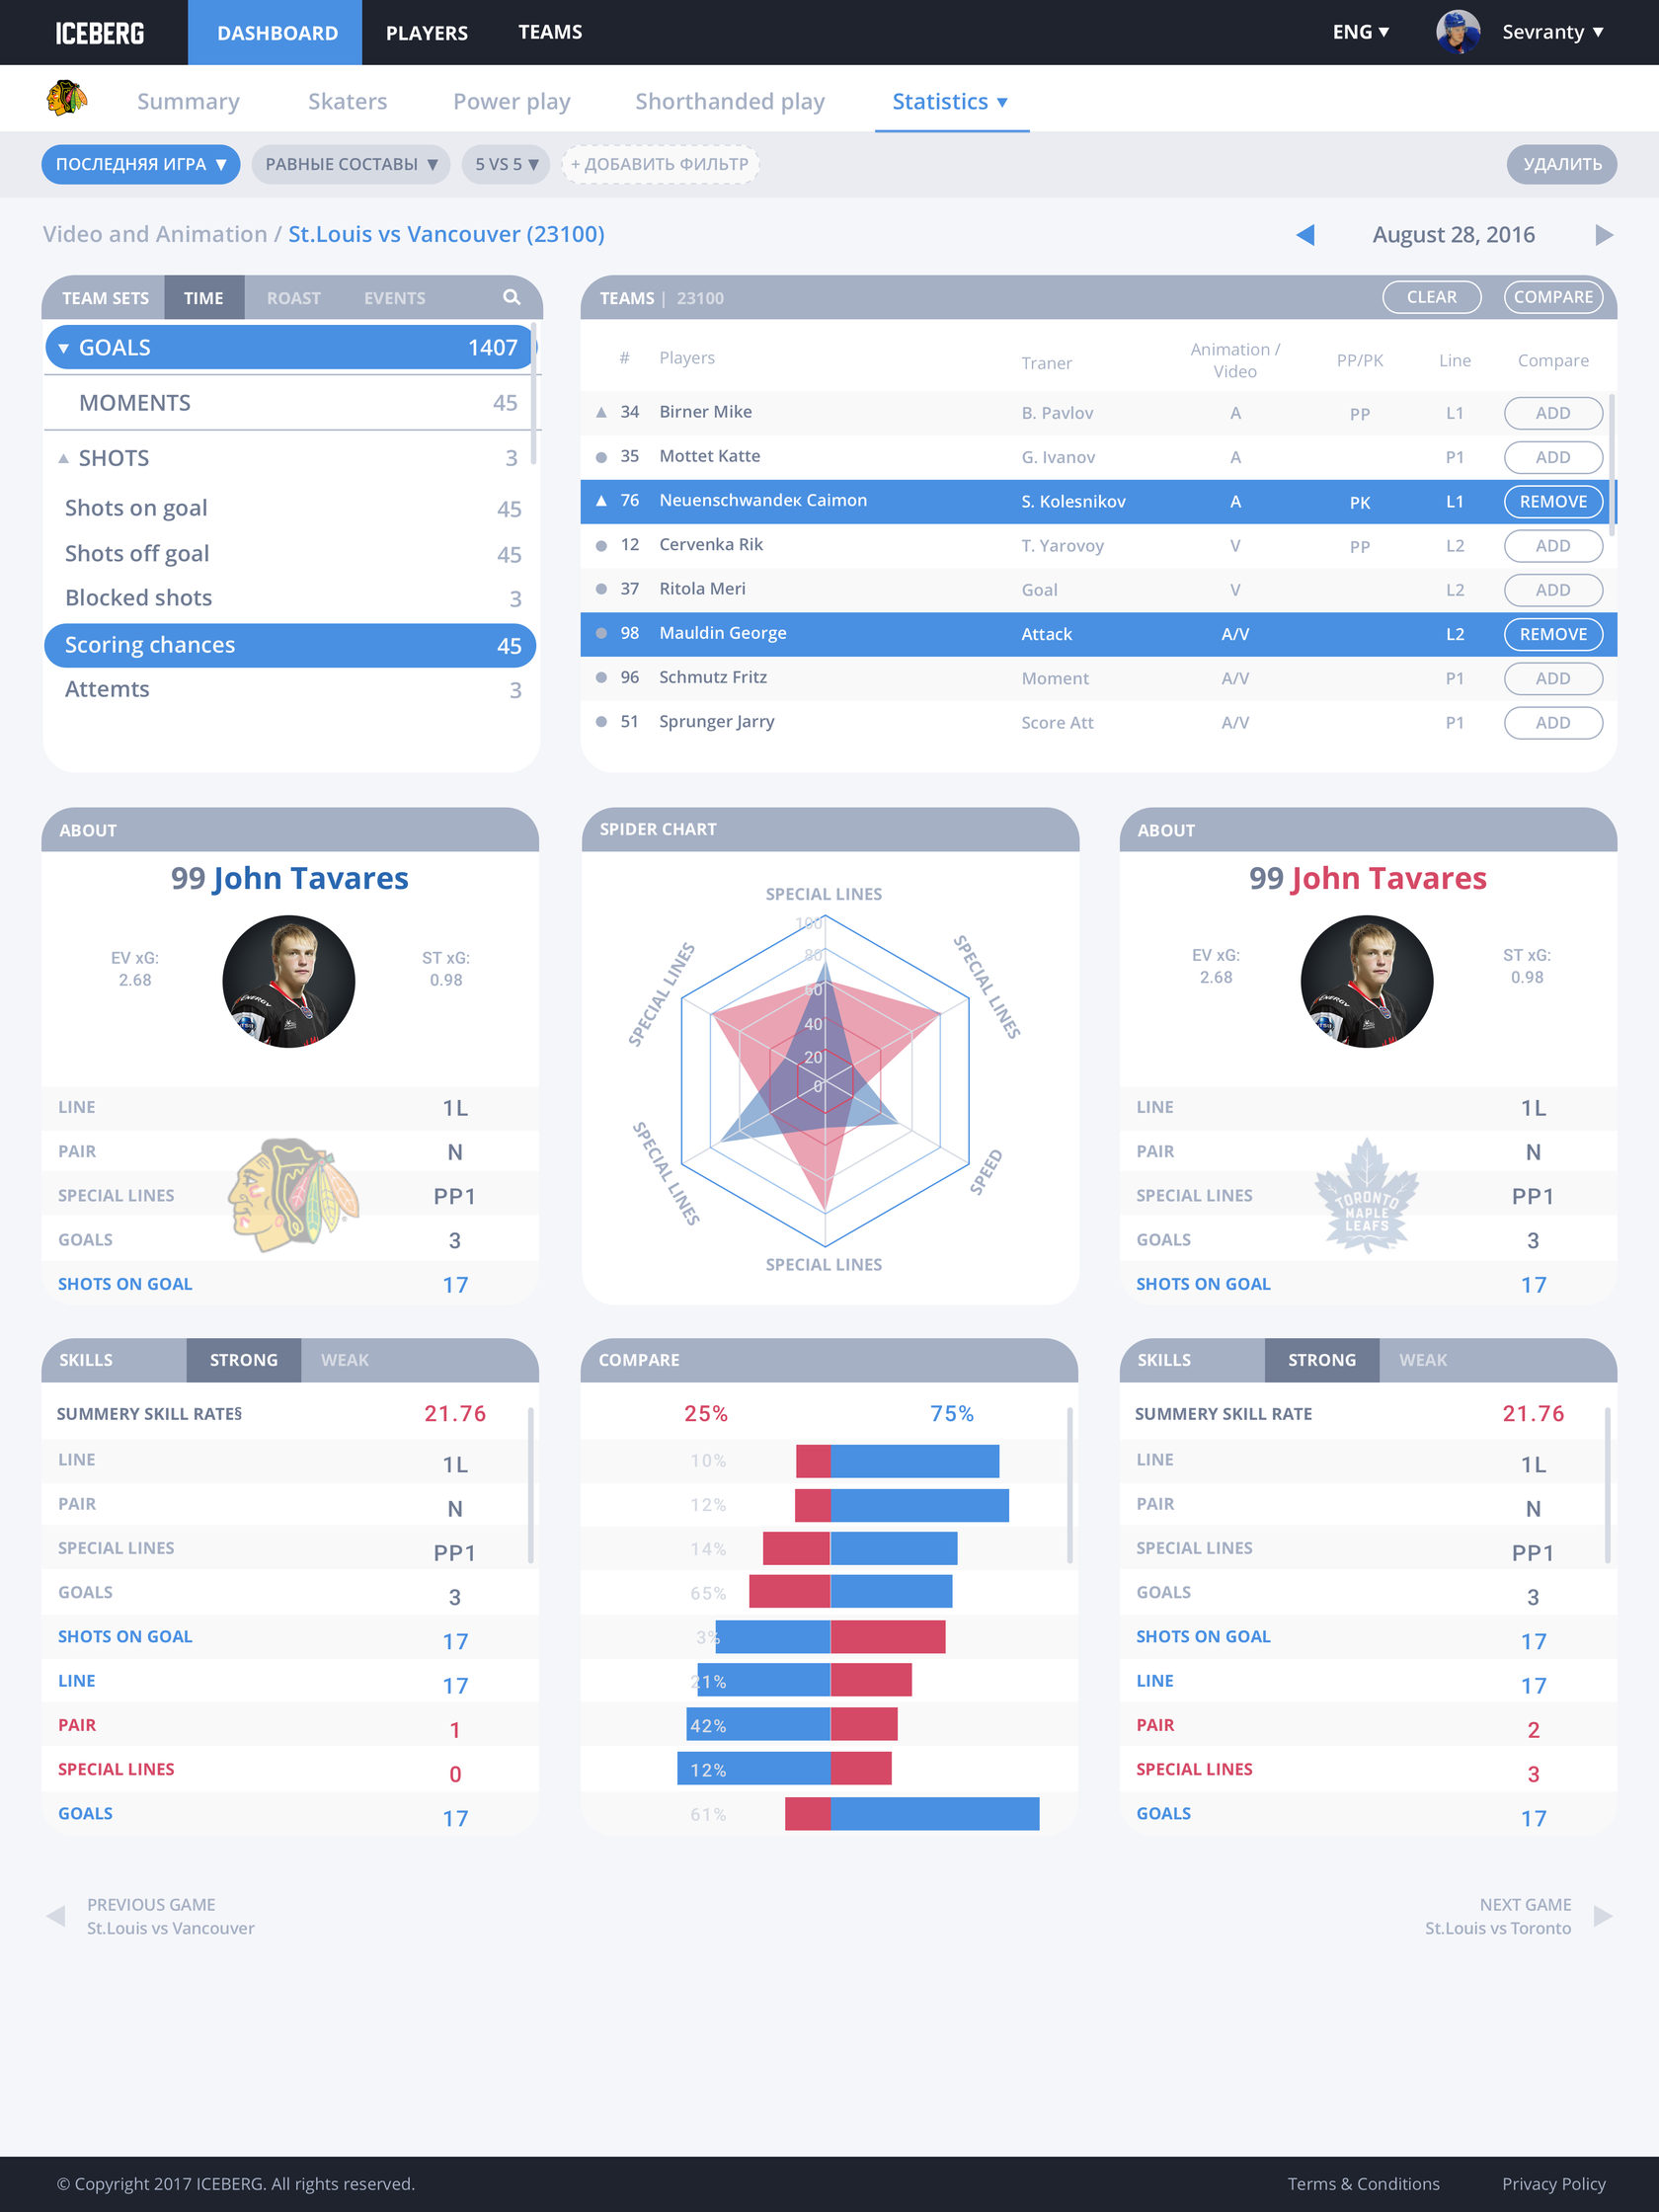
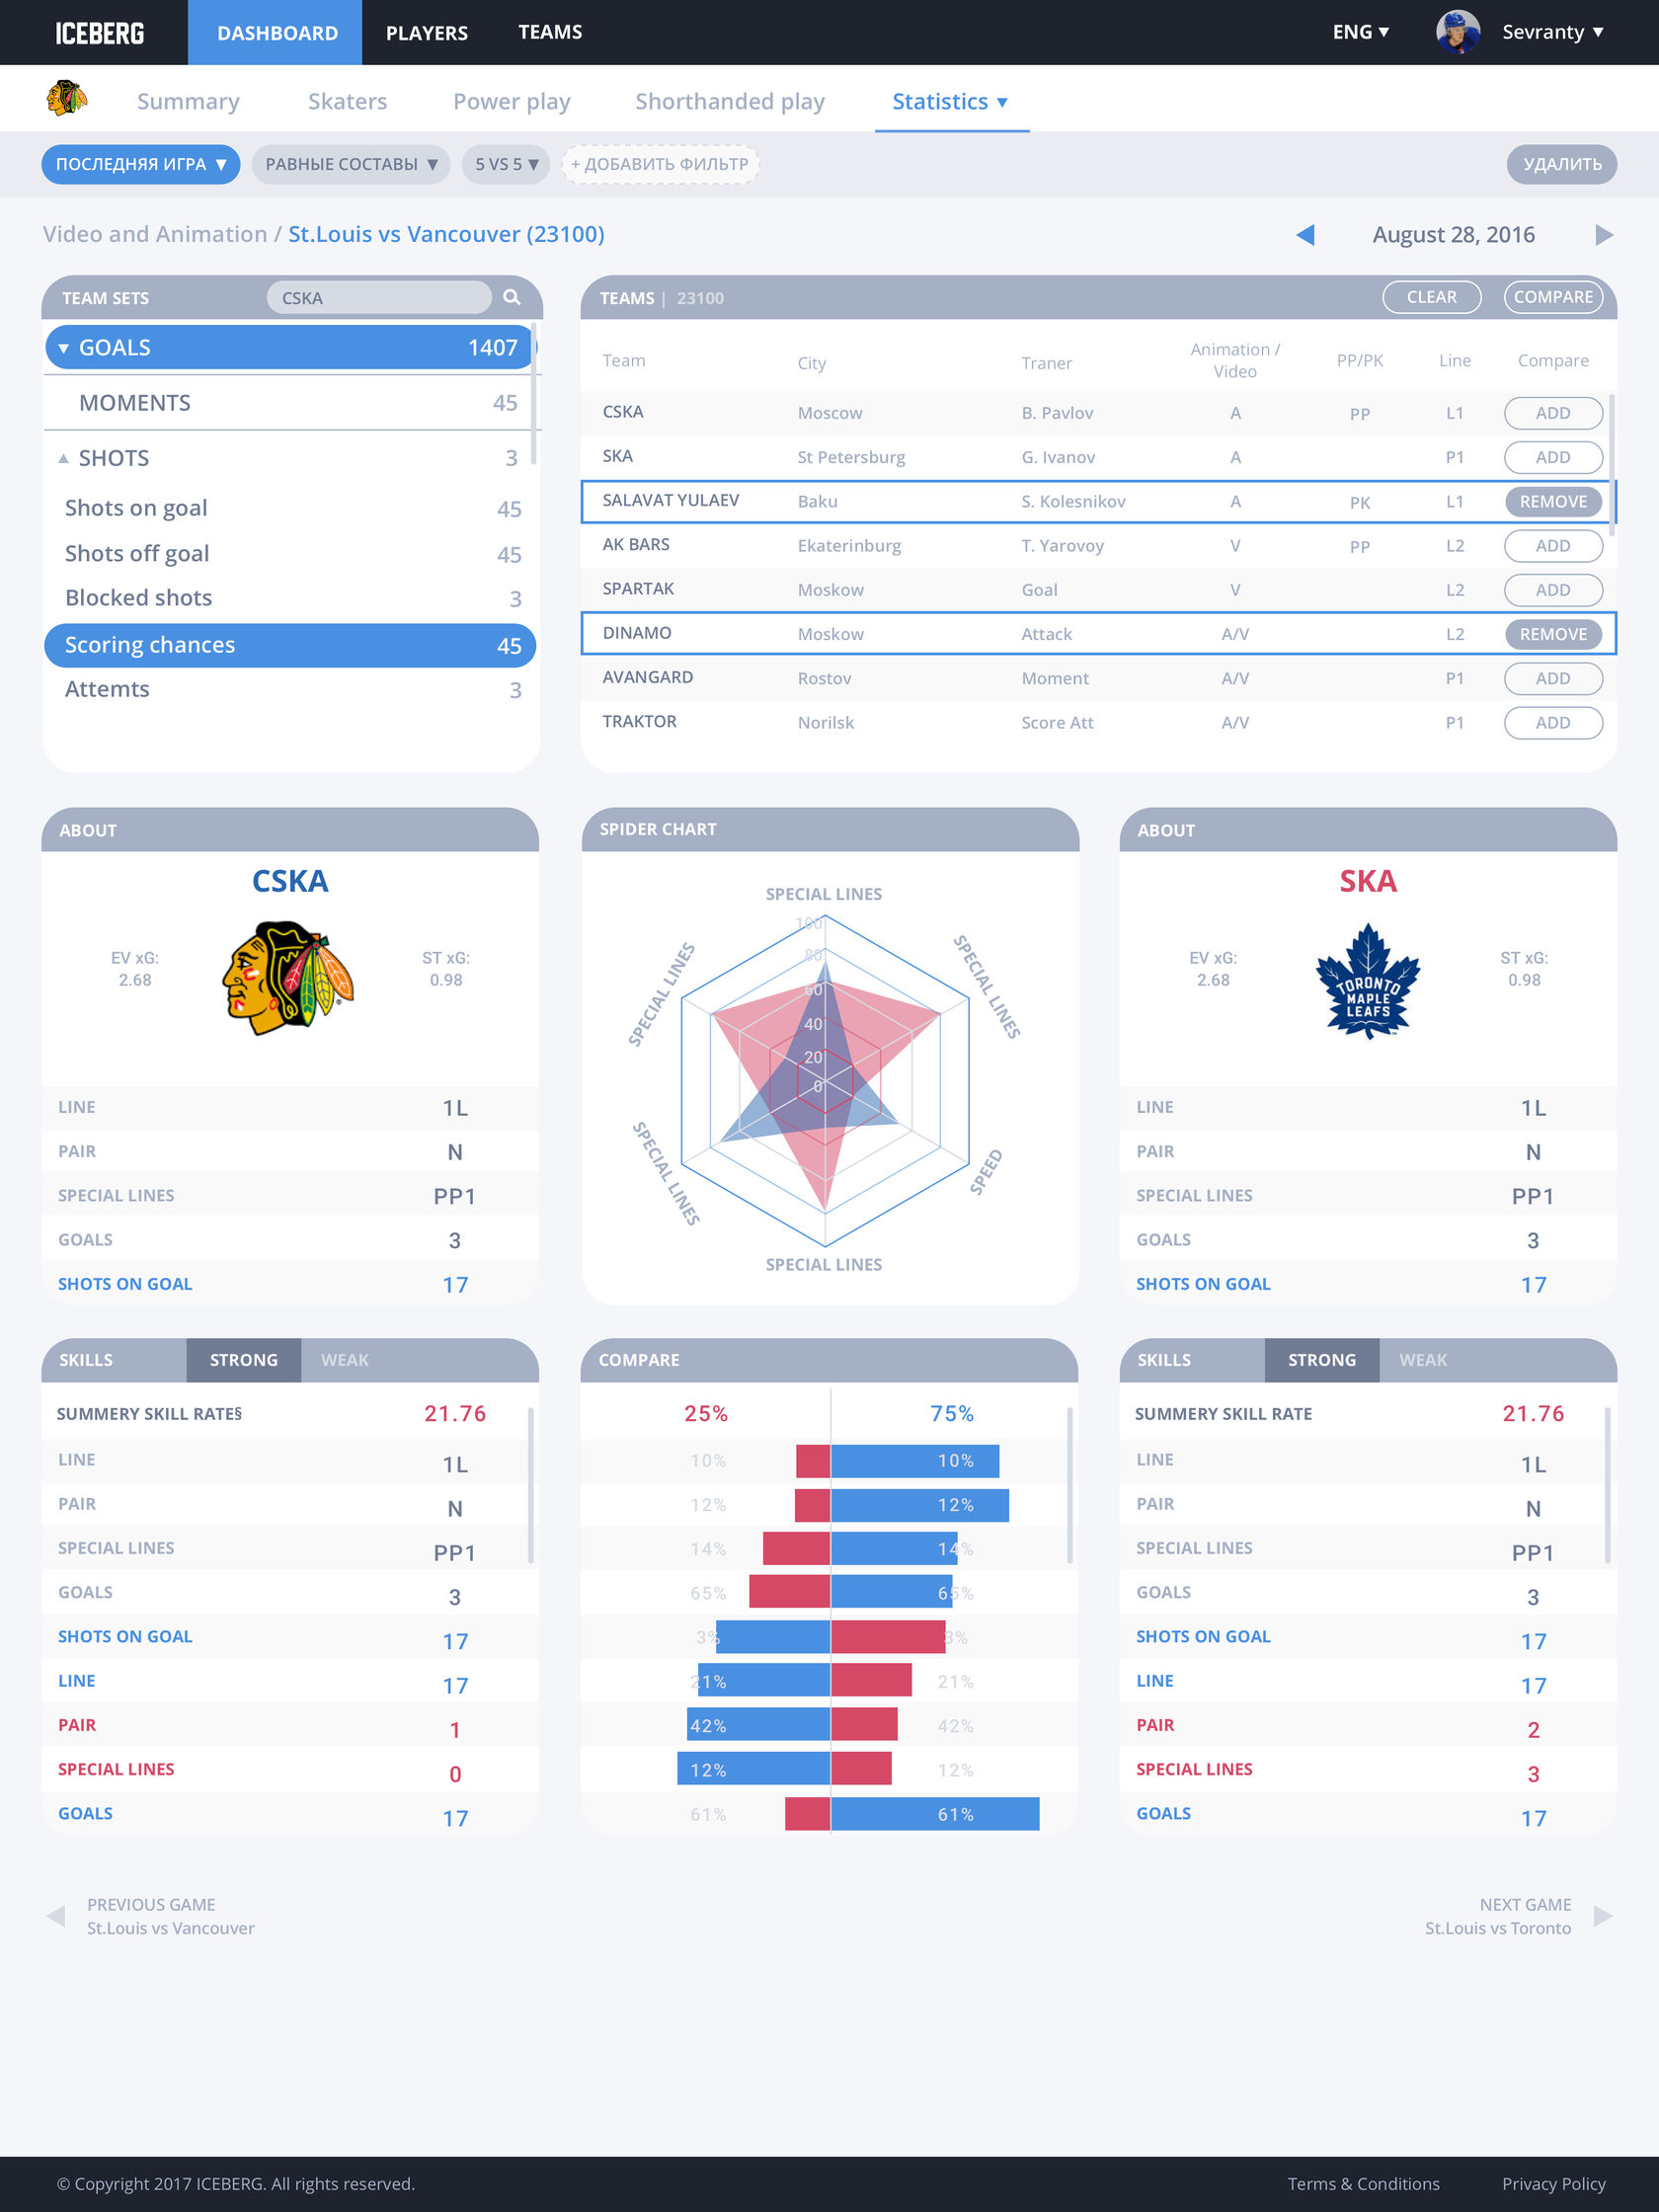
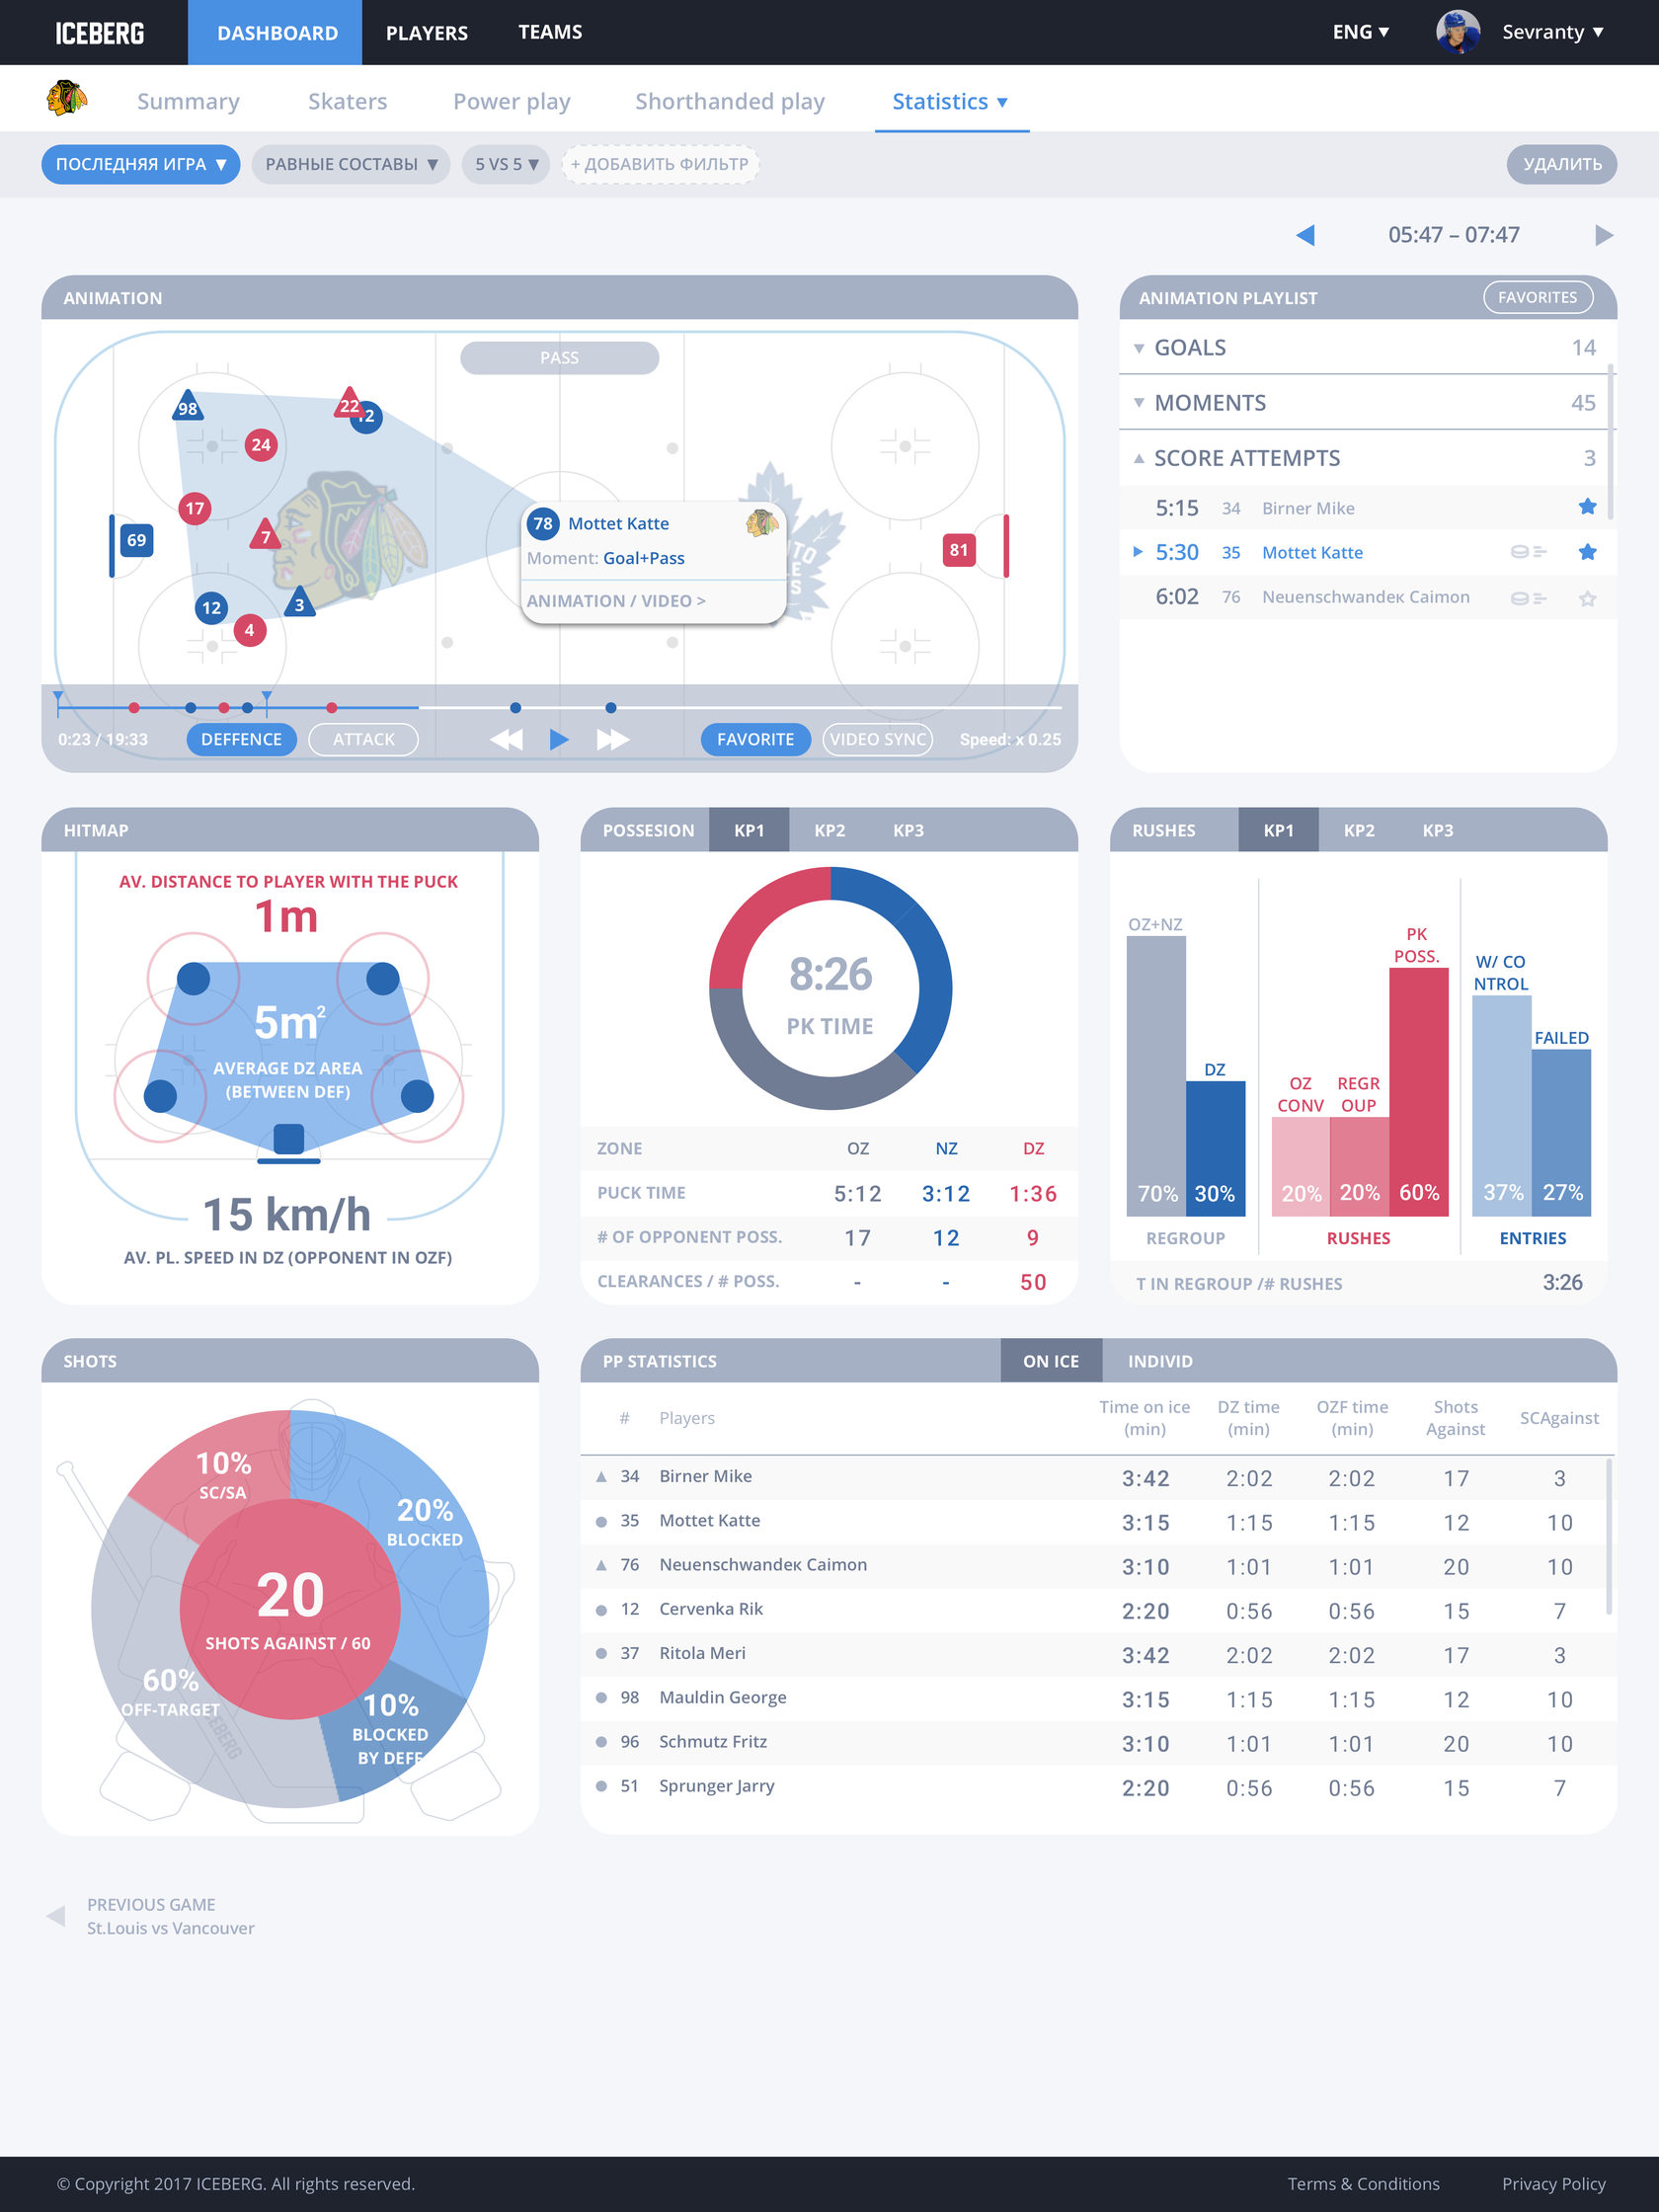
Iceberg helps trainers and players establish tactics, find players, collect teams and win using hockey data analytics. It displays real-life data, as it is a computer game: goals, passes, zone enters, and even who acts fun or dull on the ice.
Data Visualisation
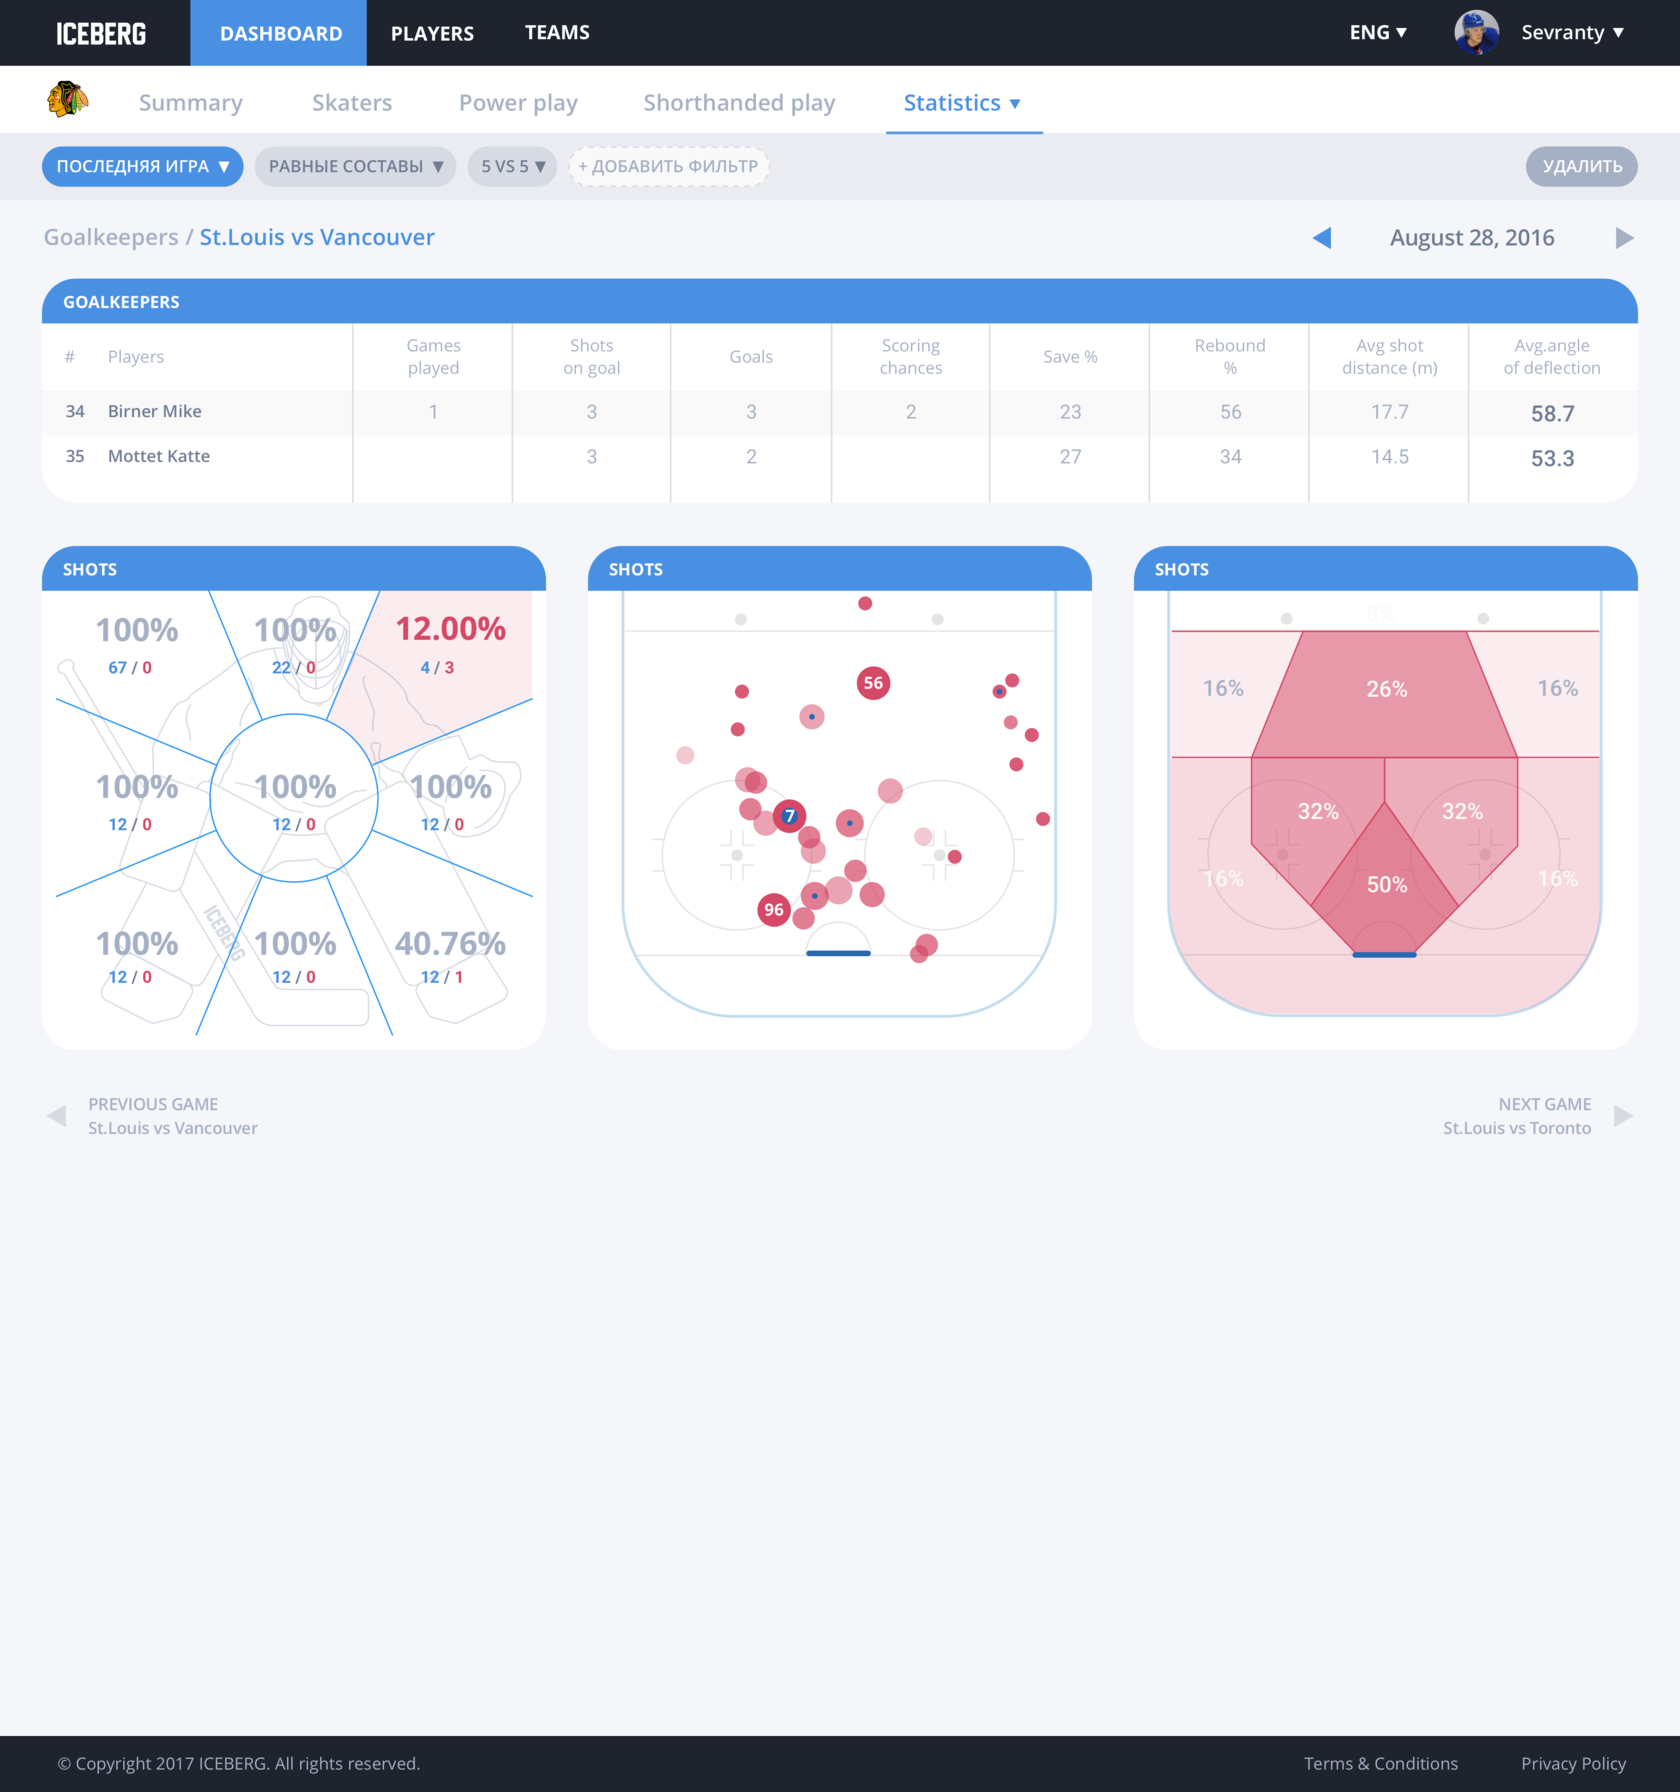
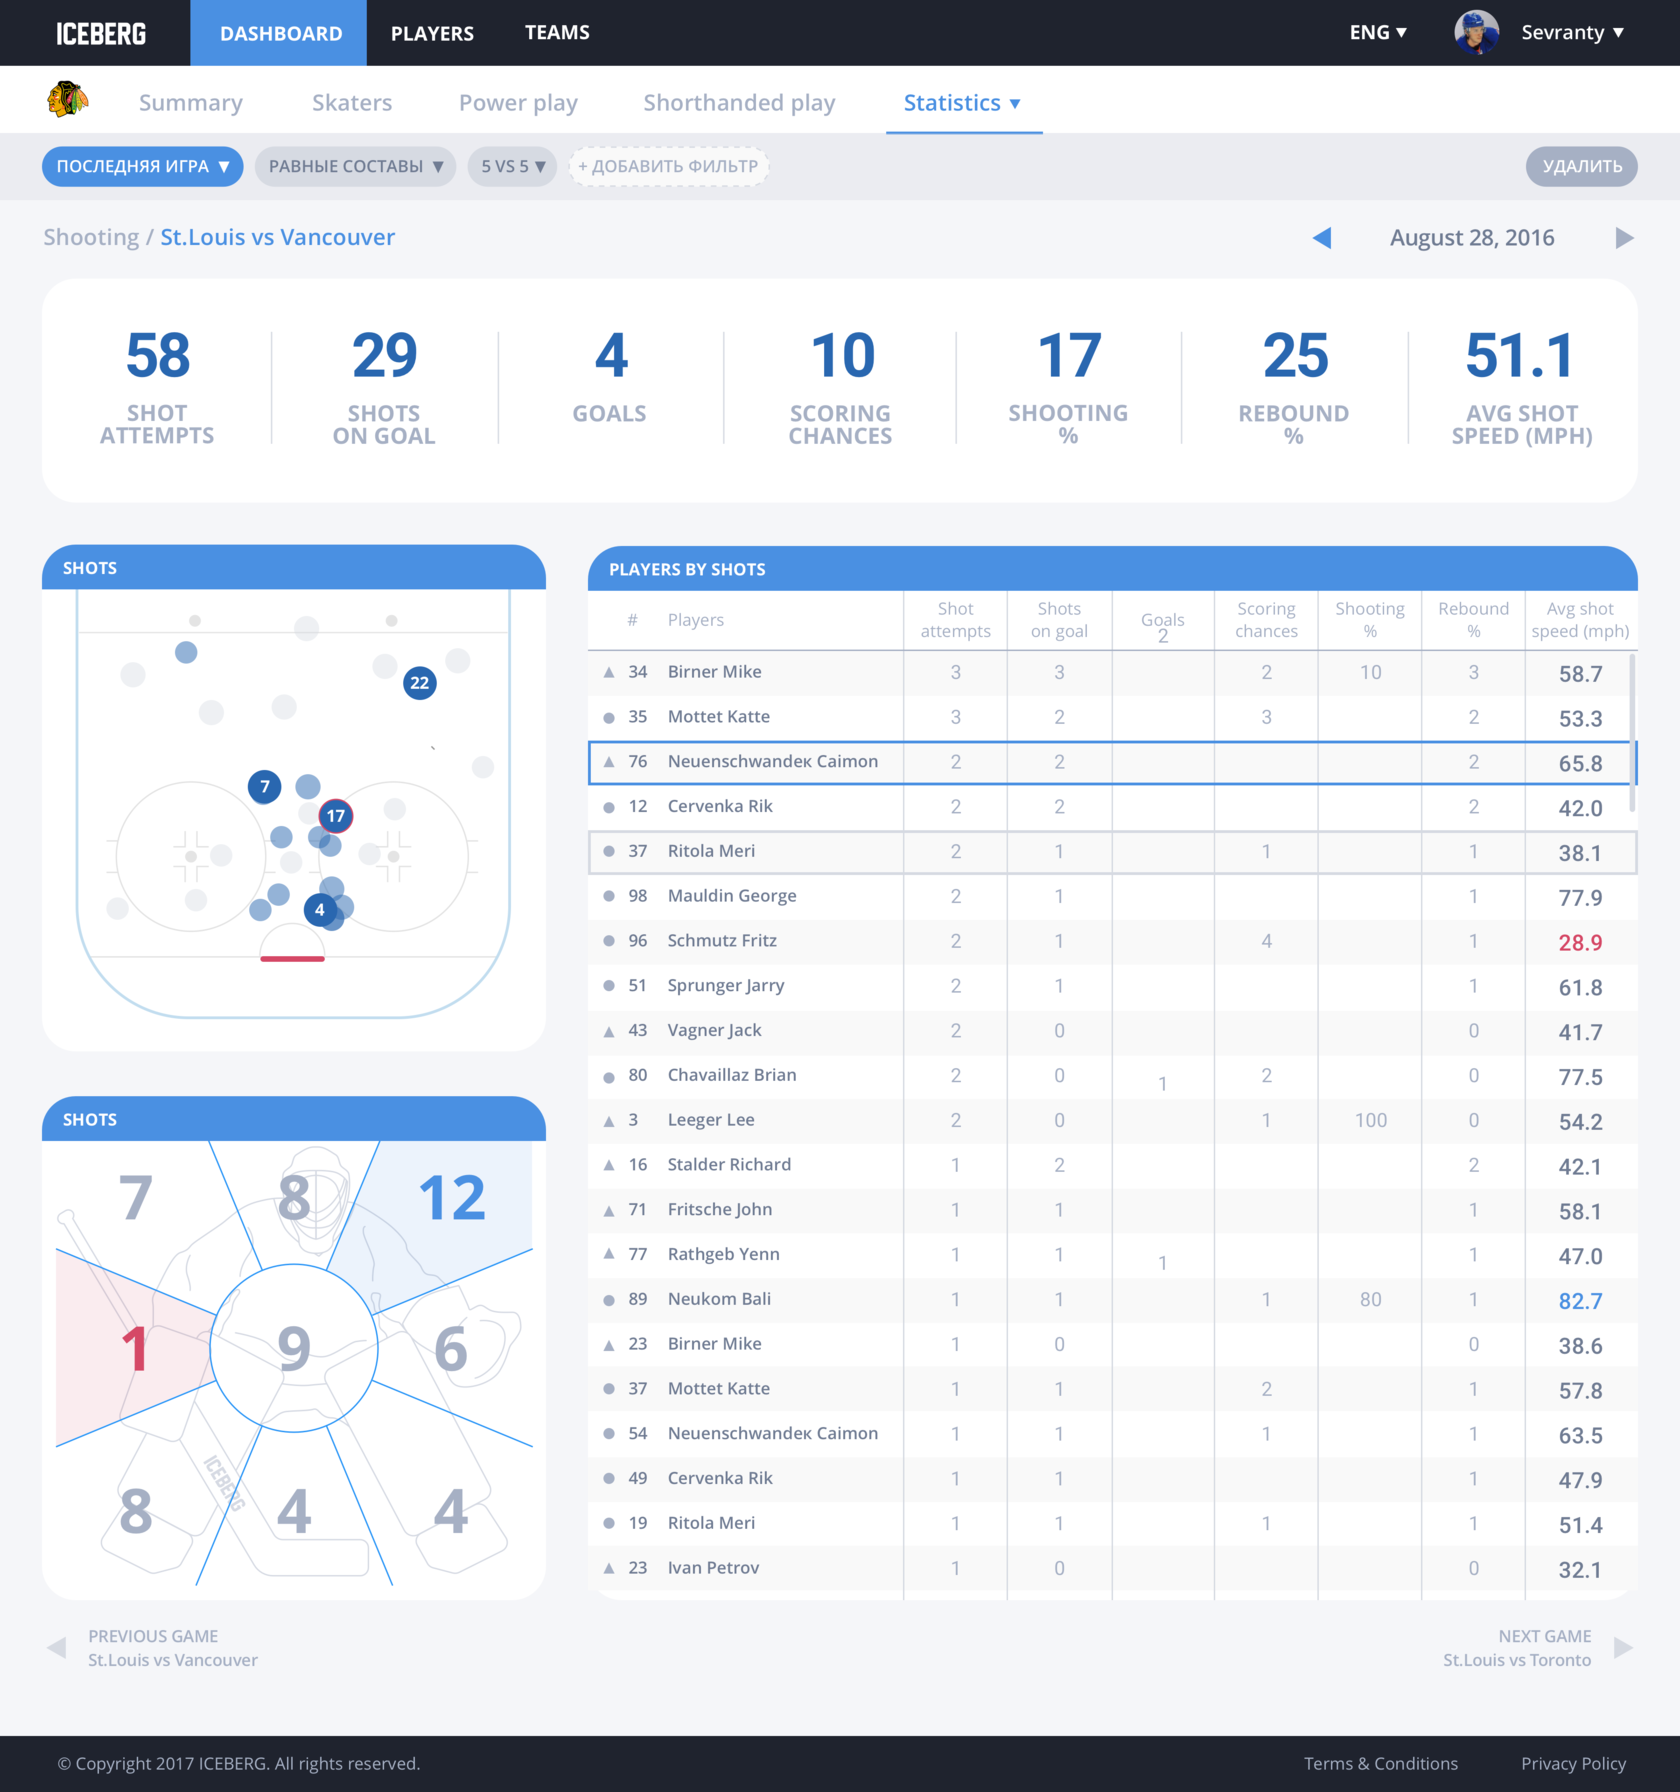
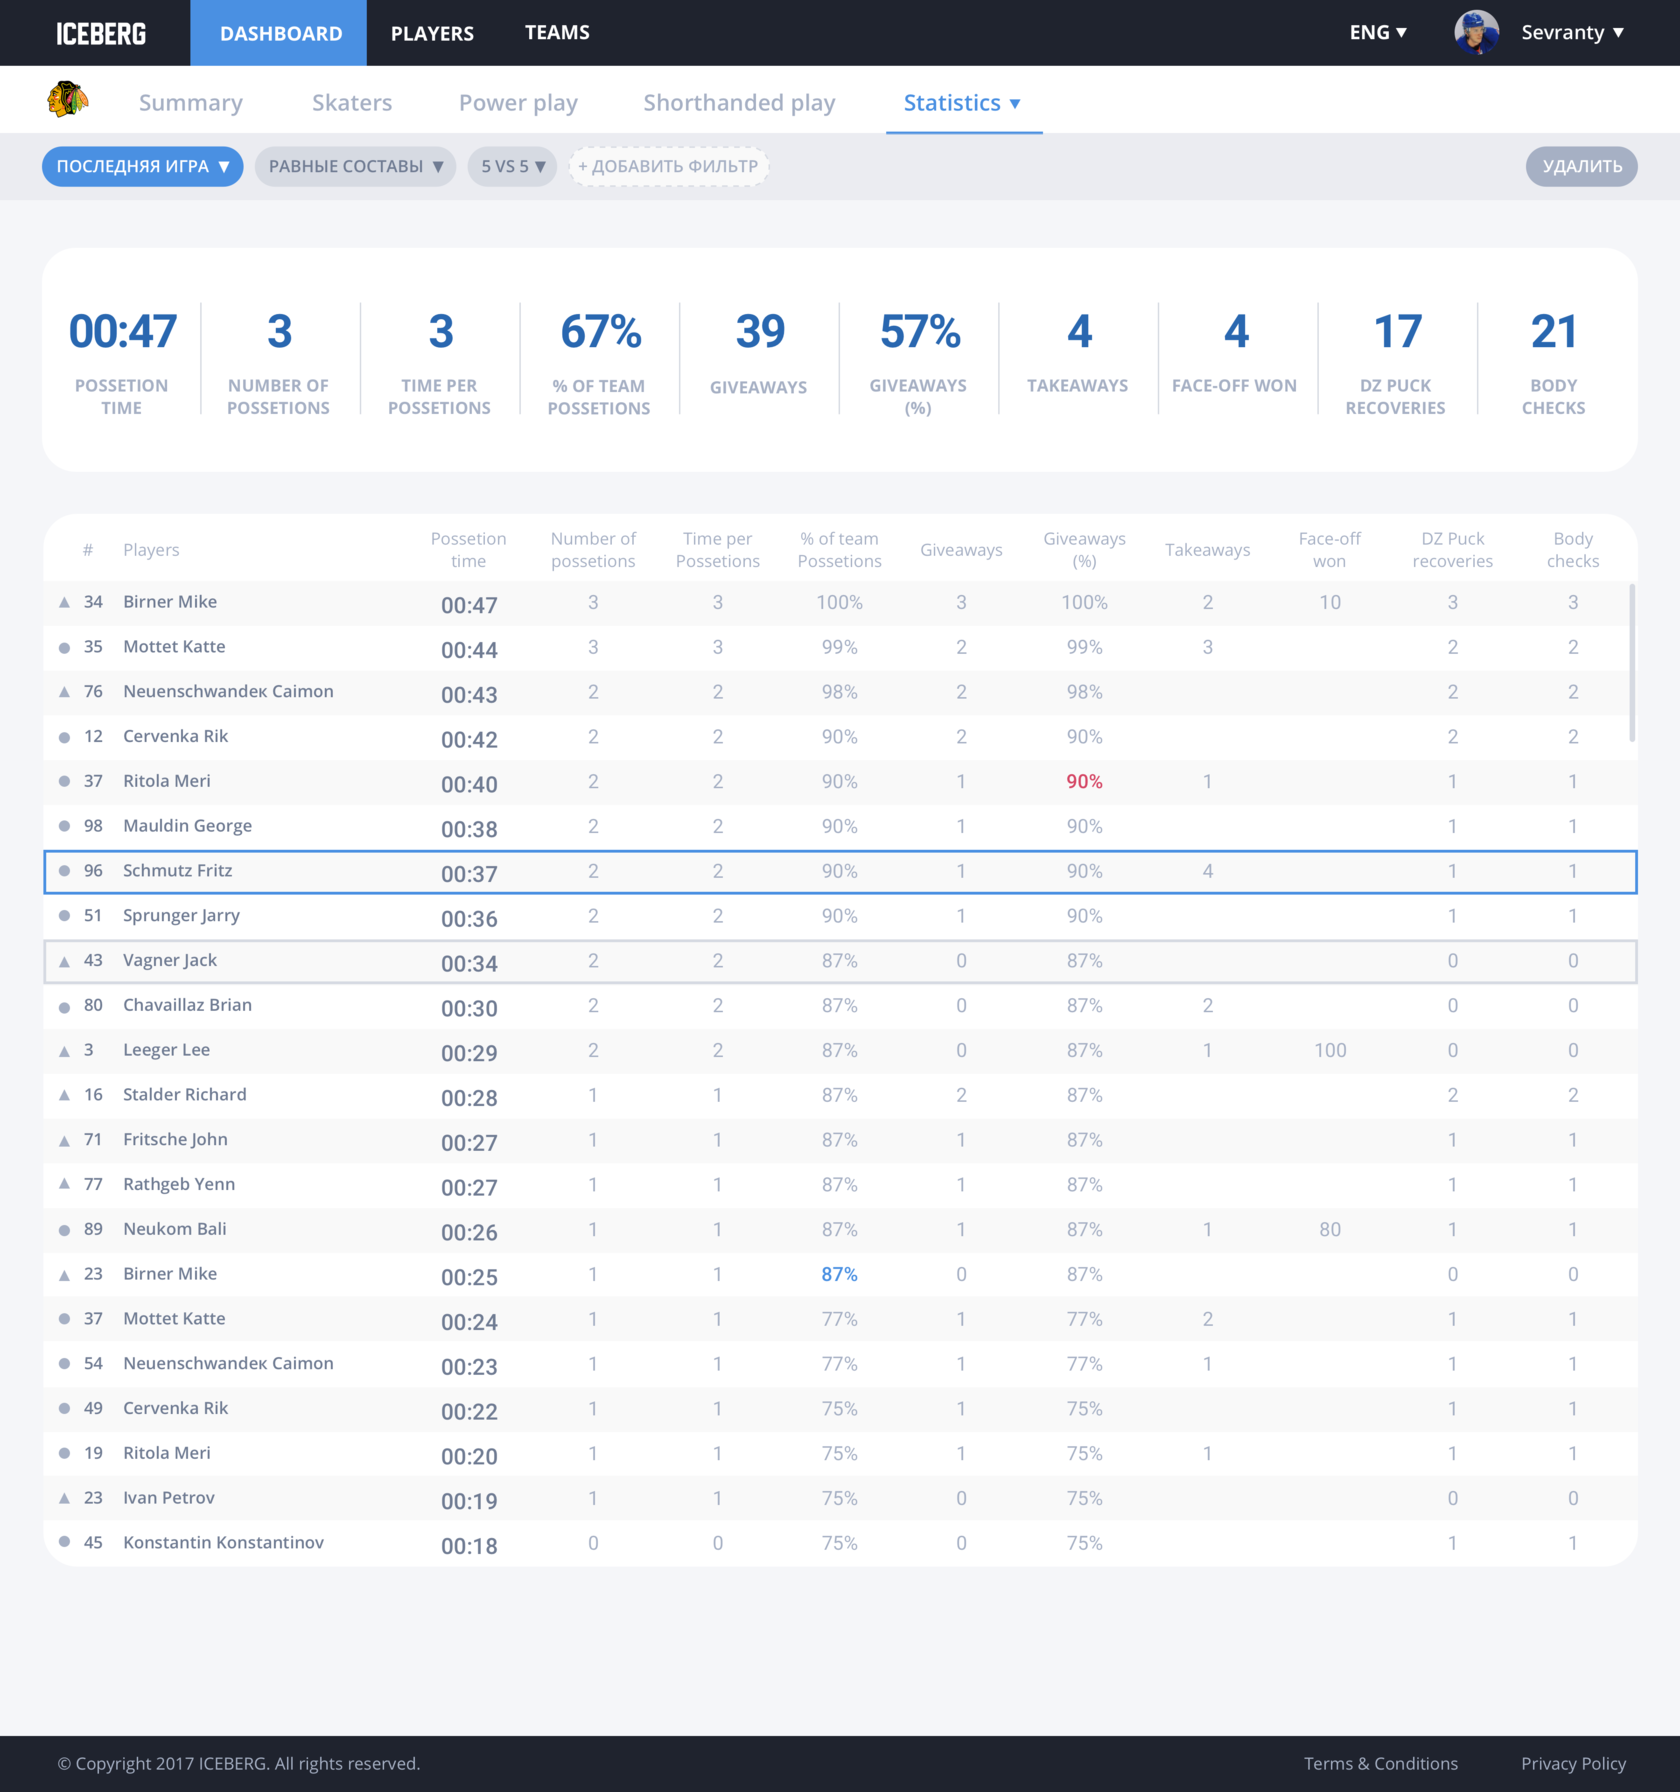
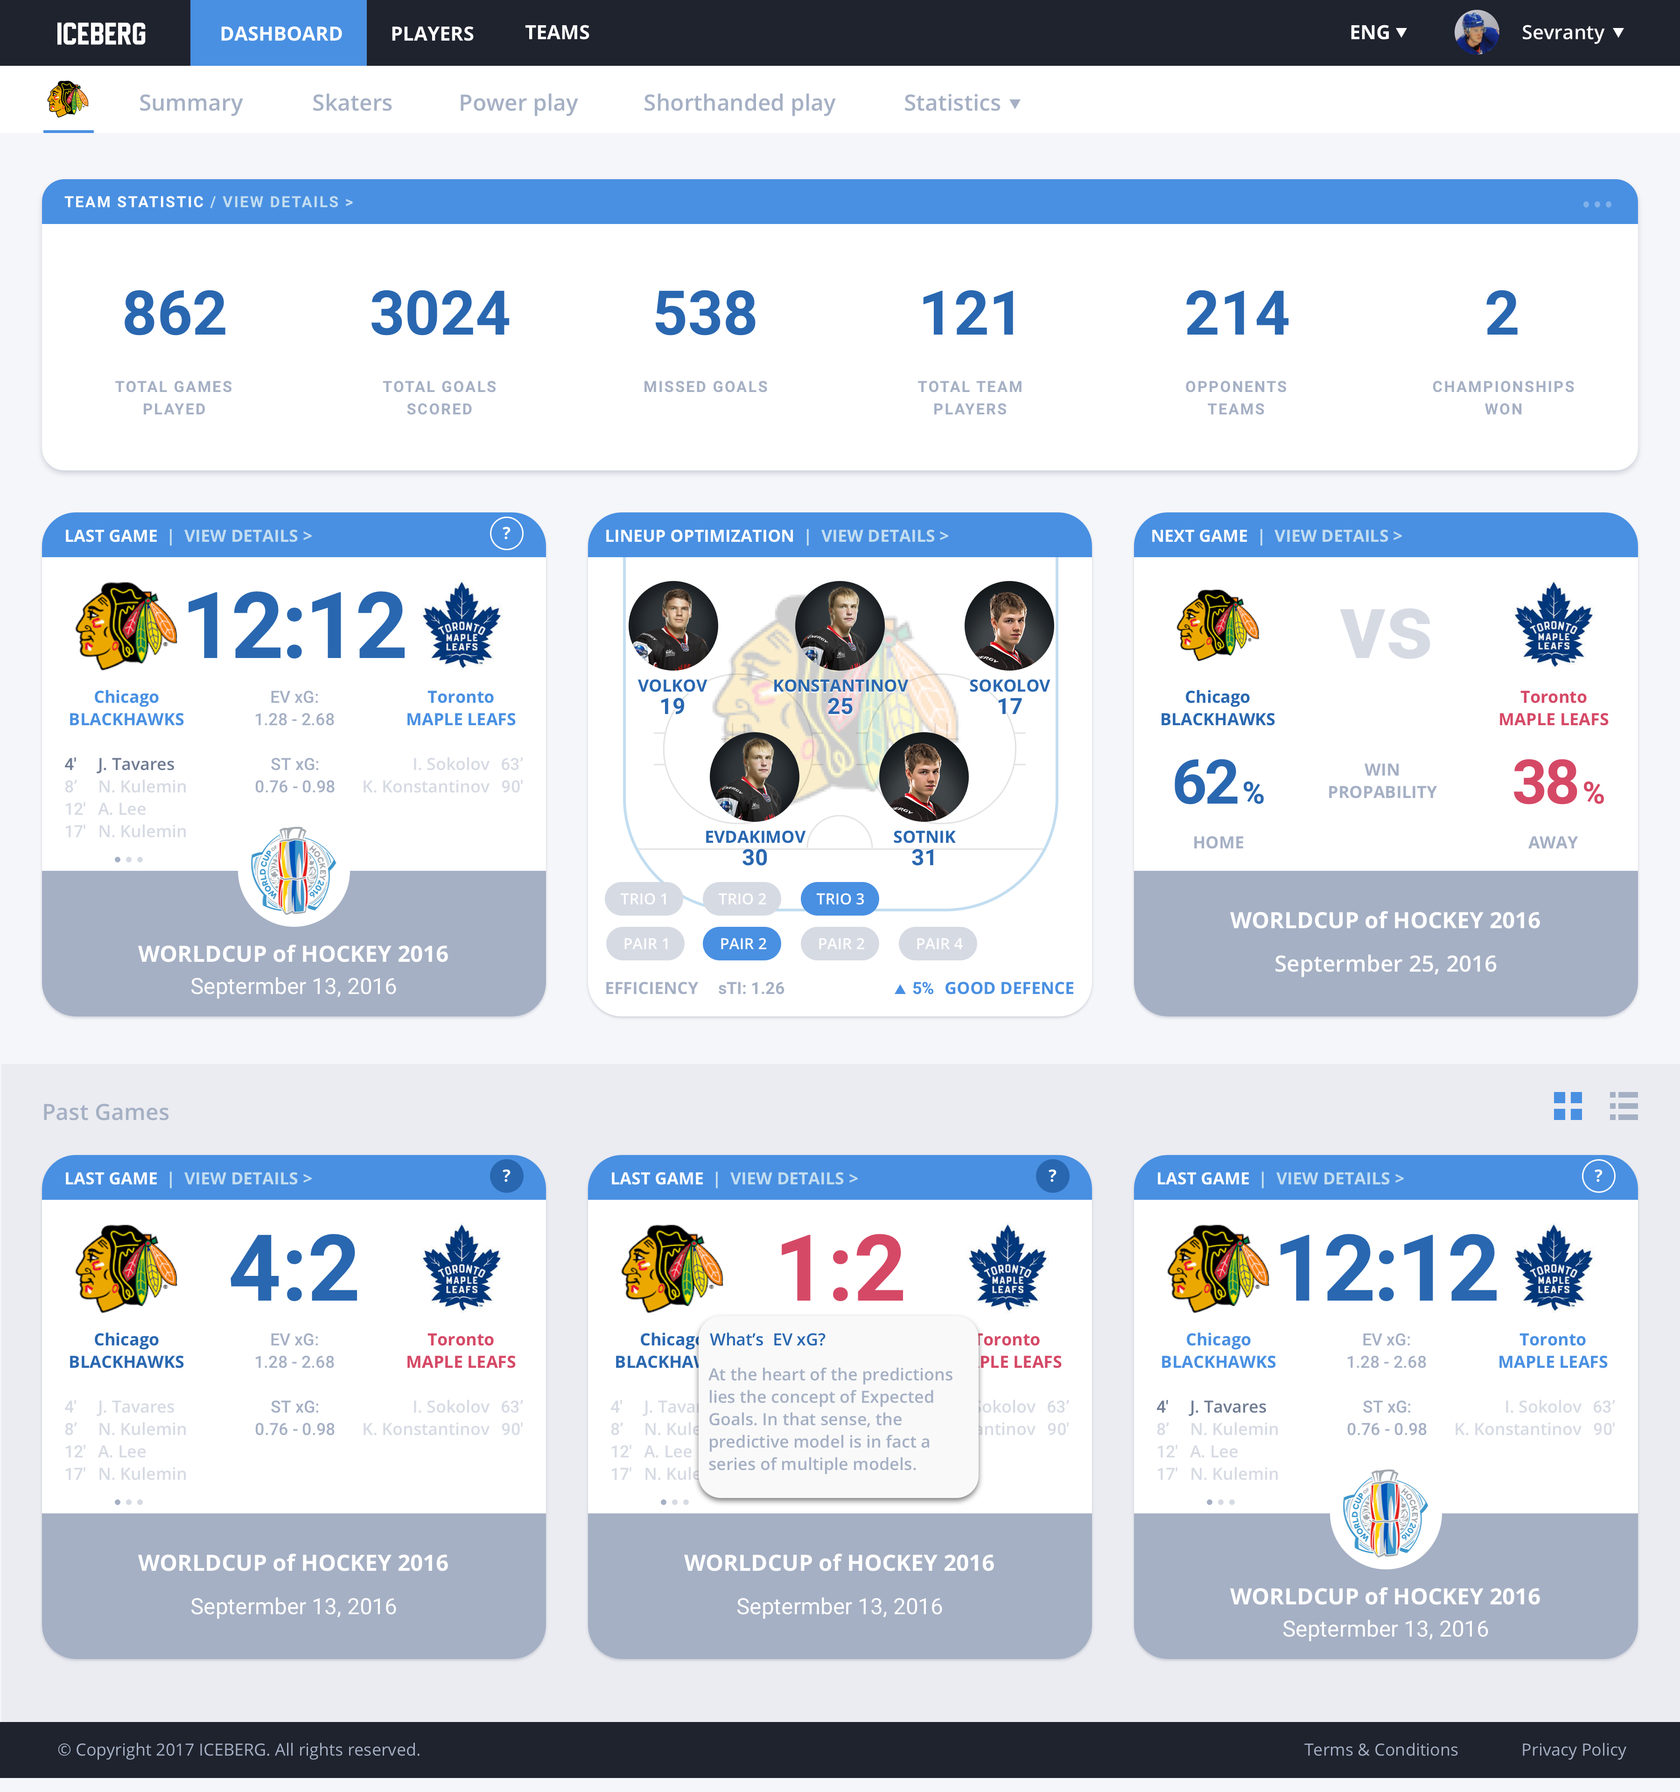
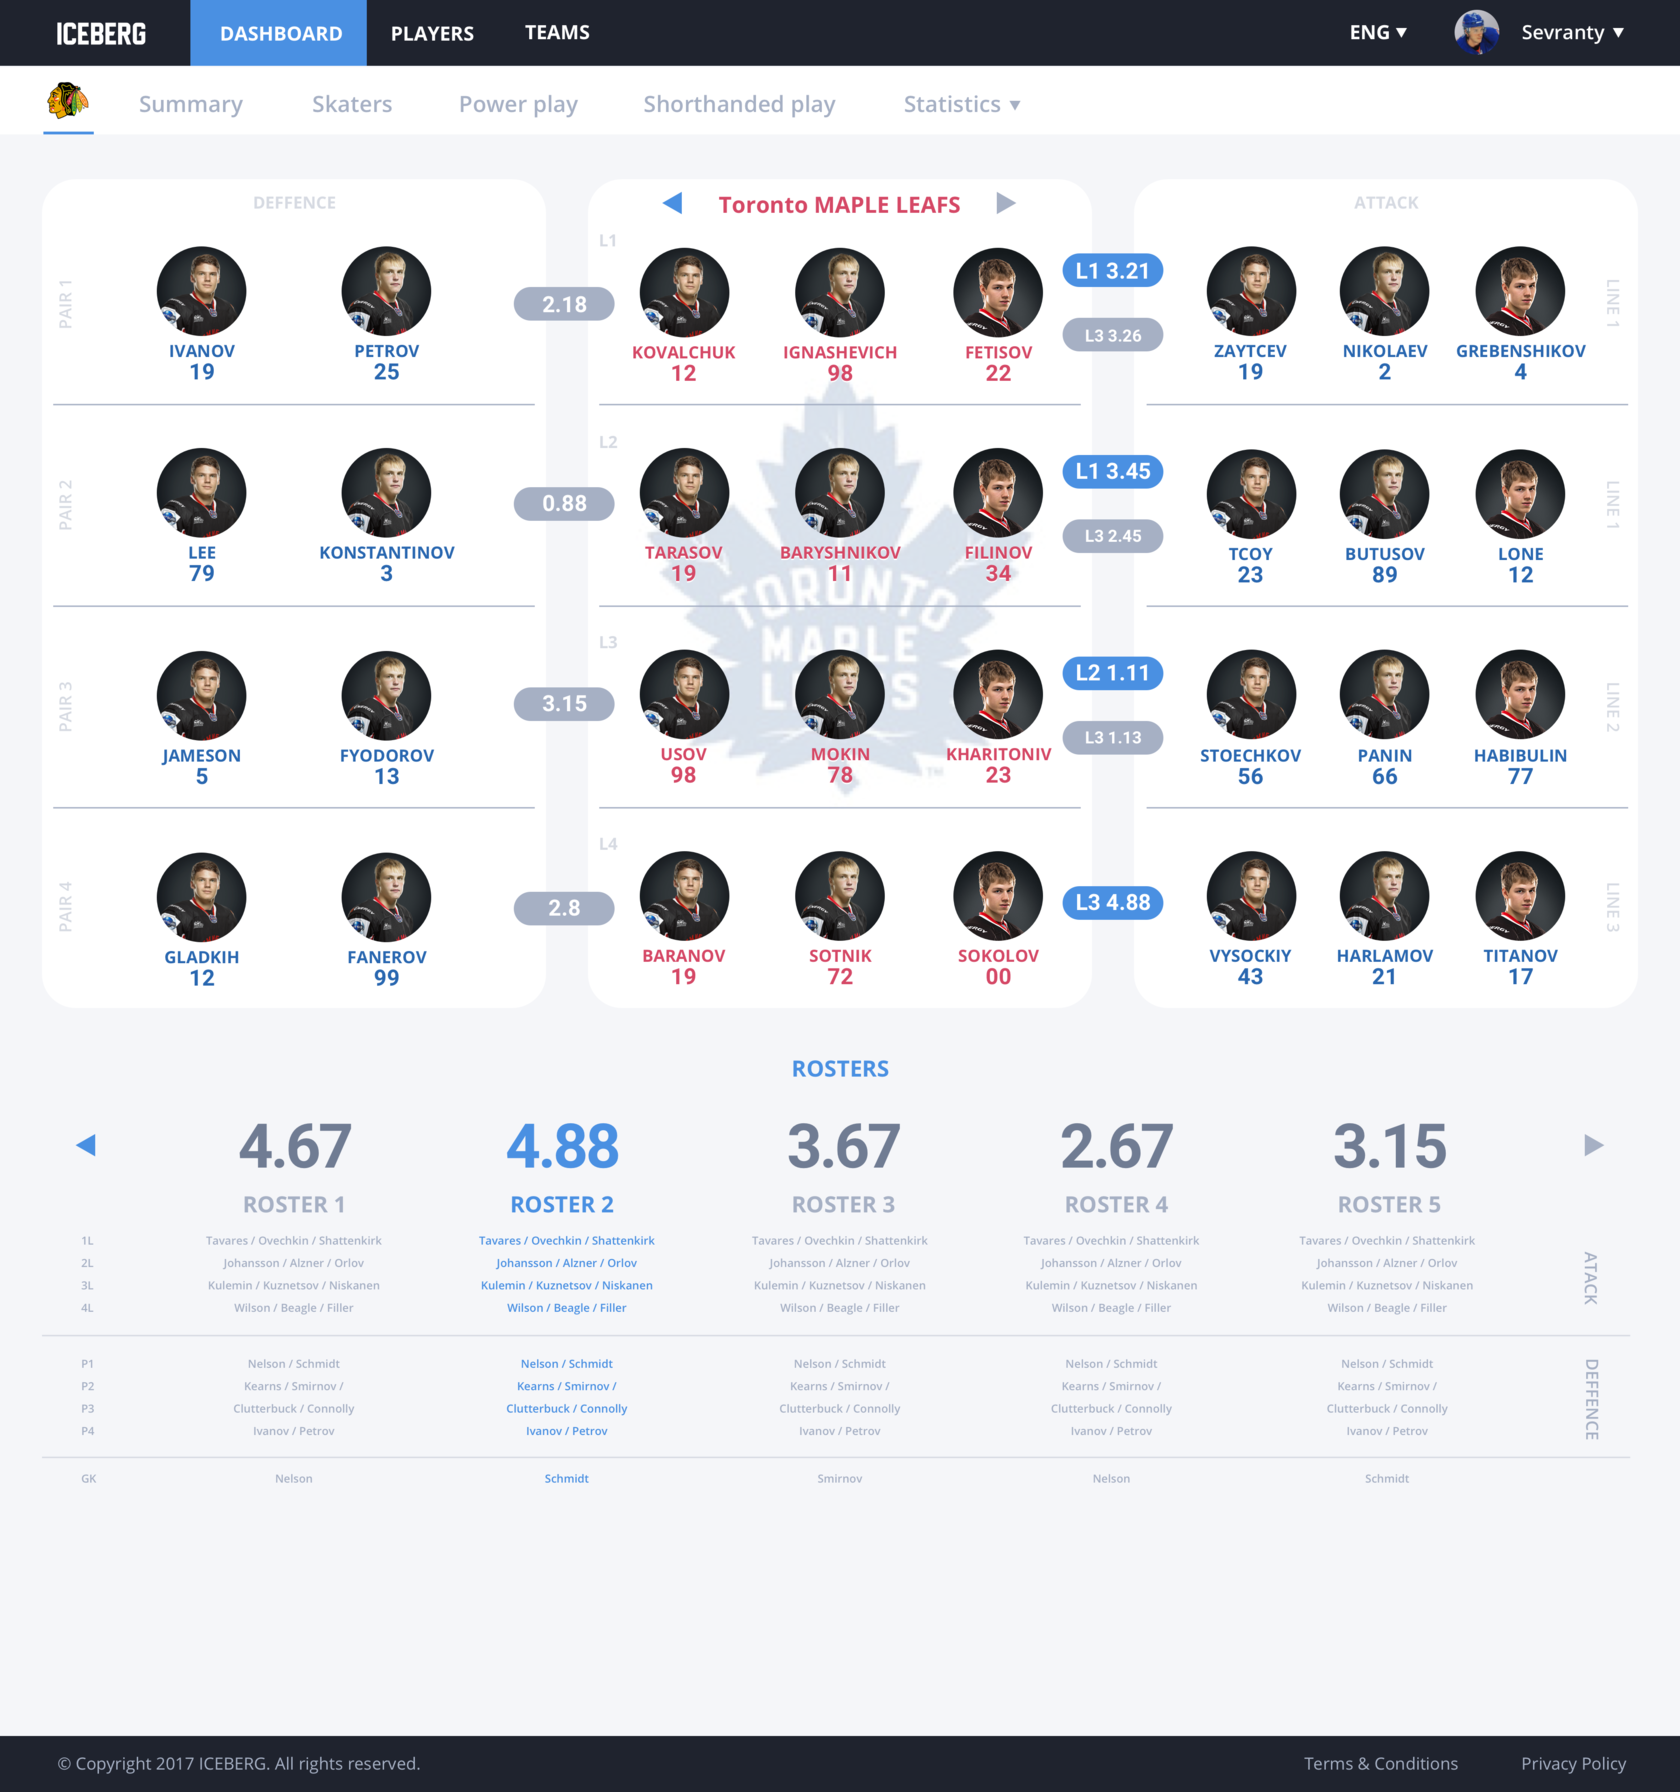
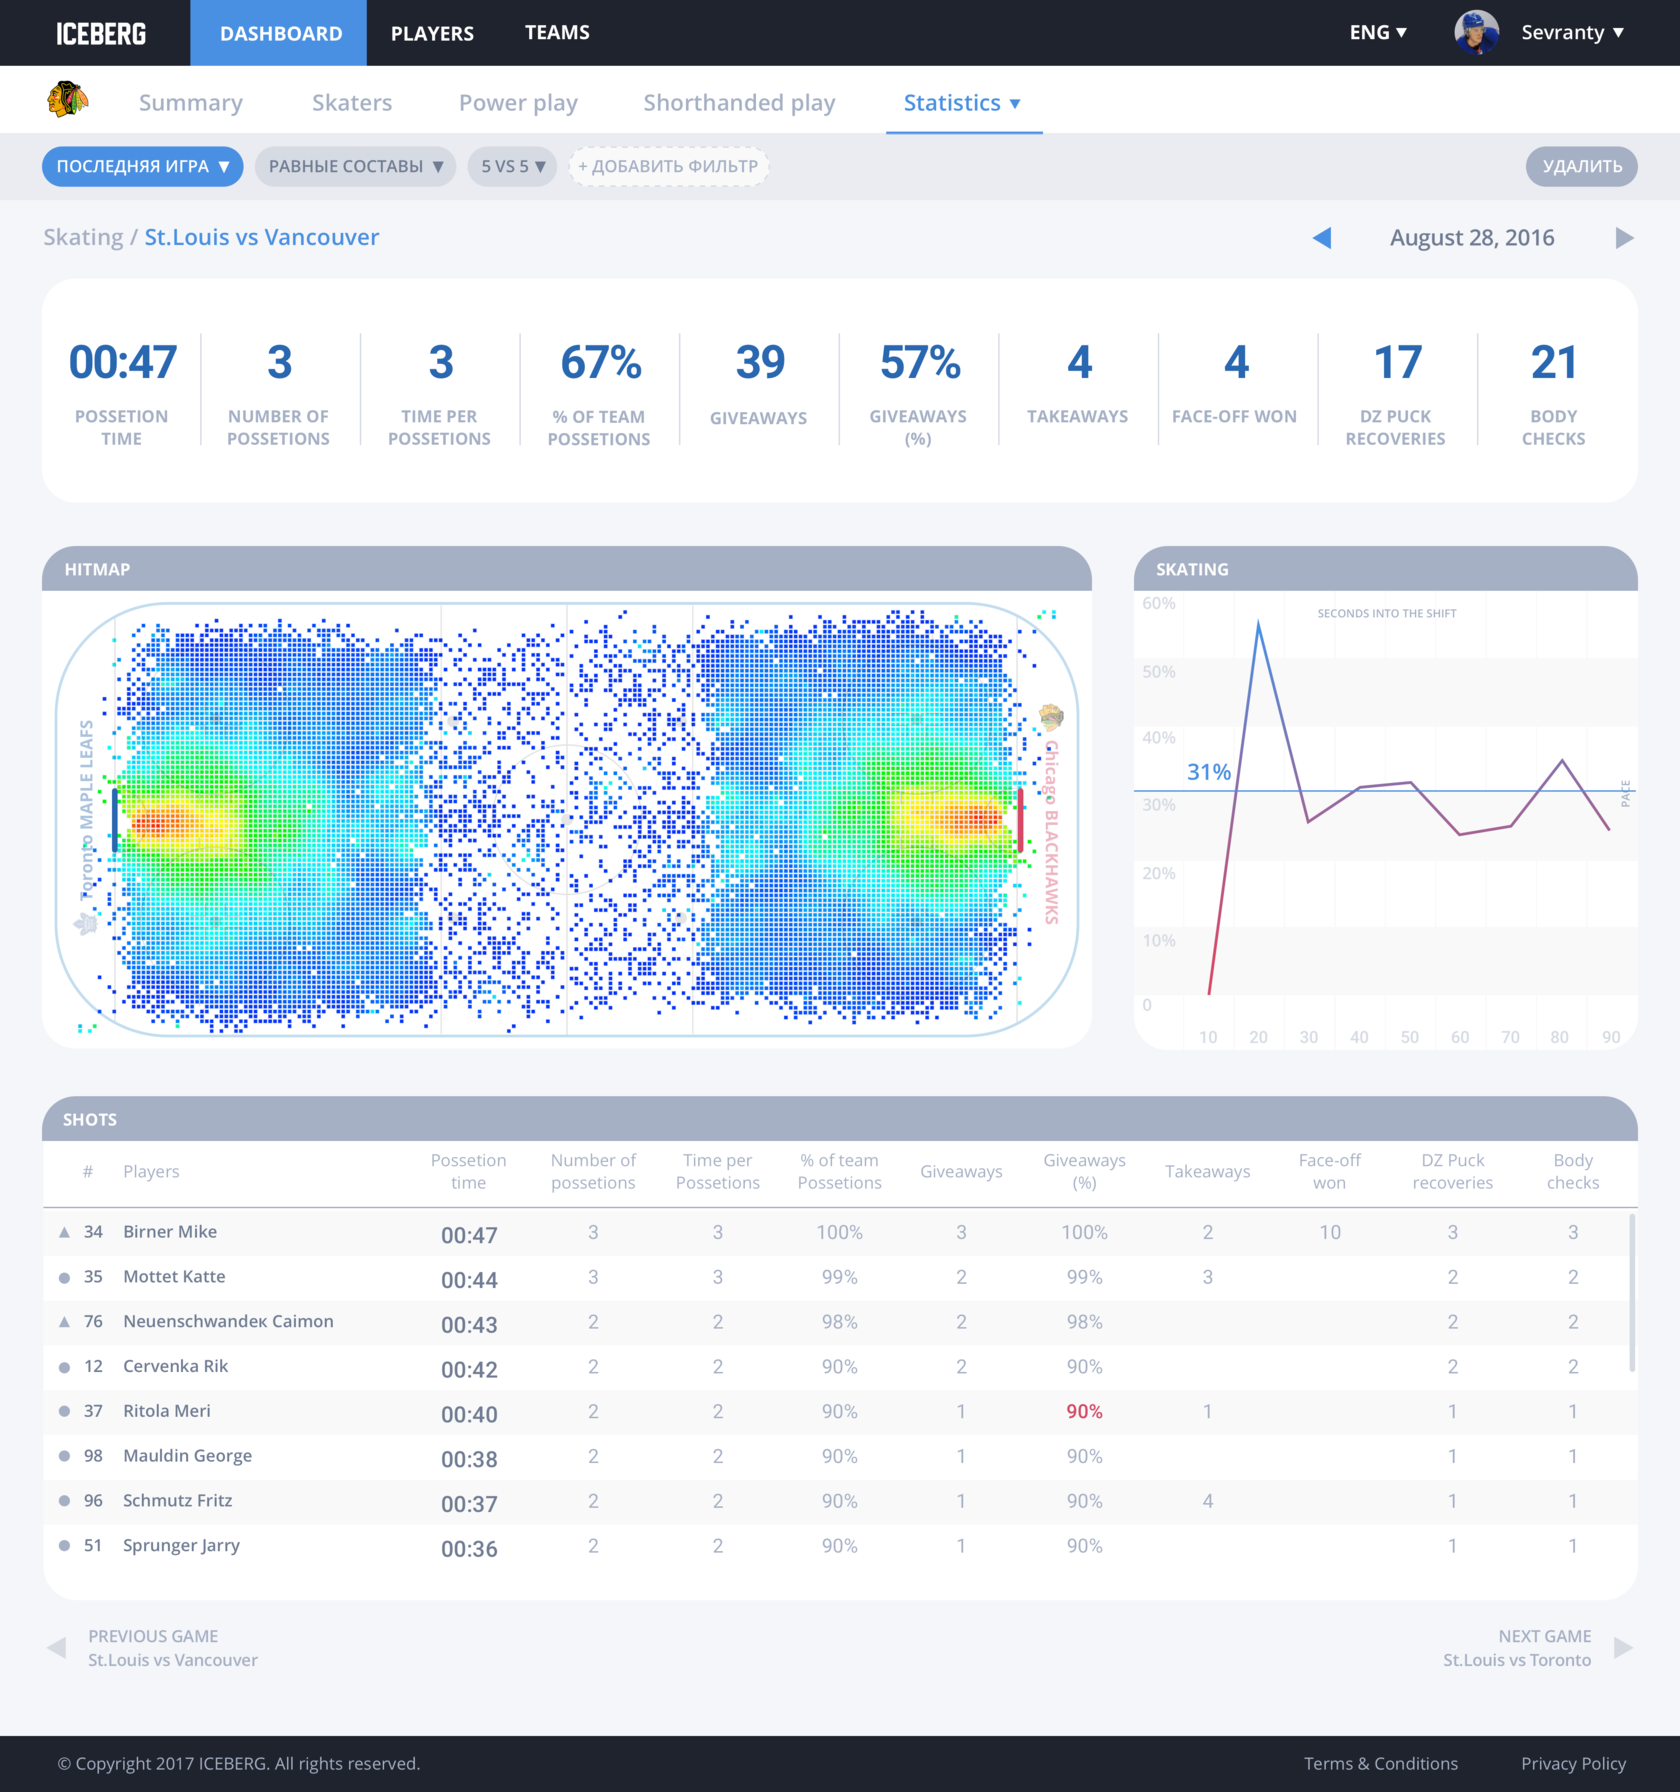
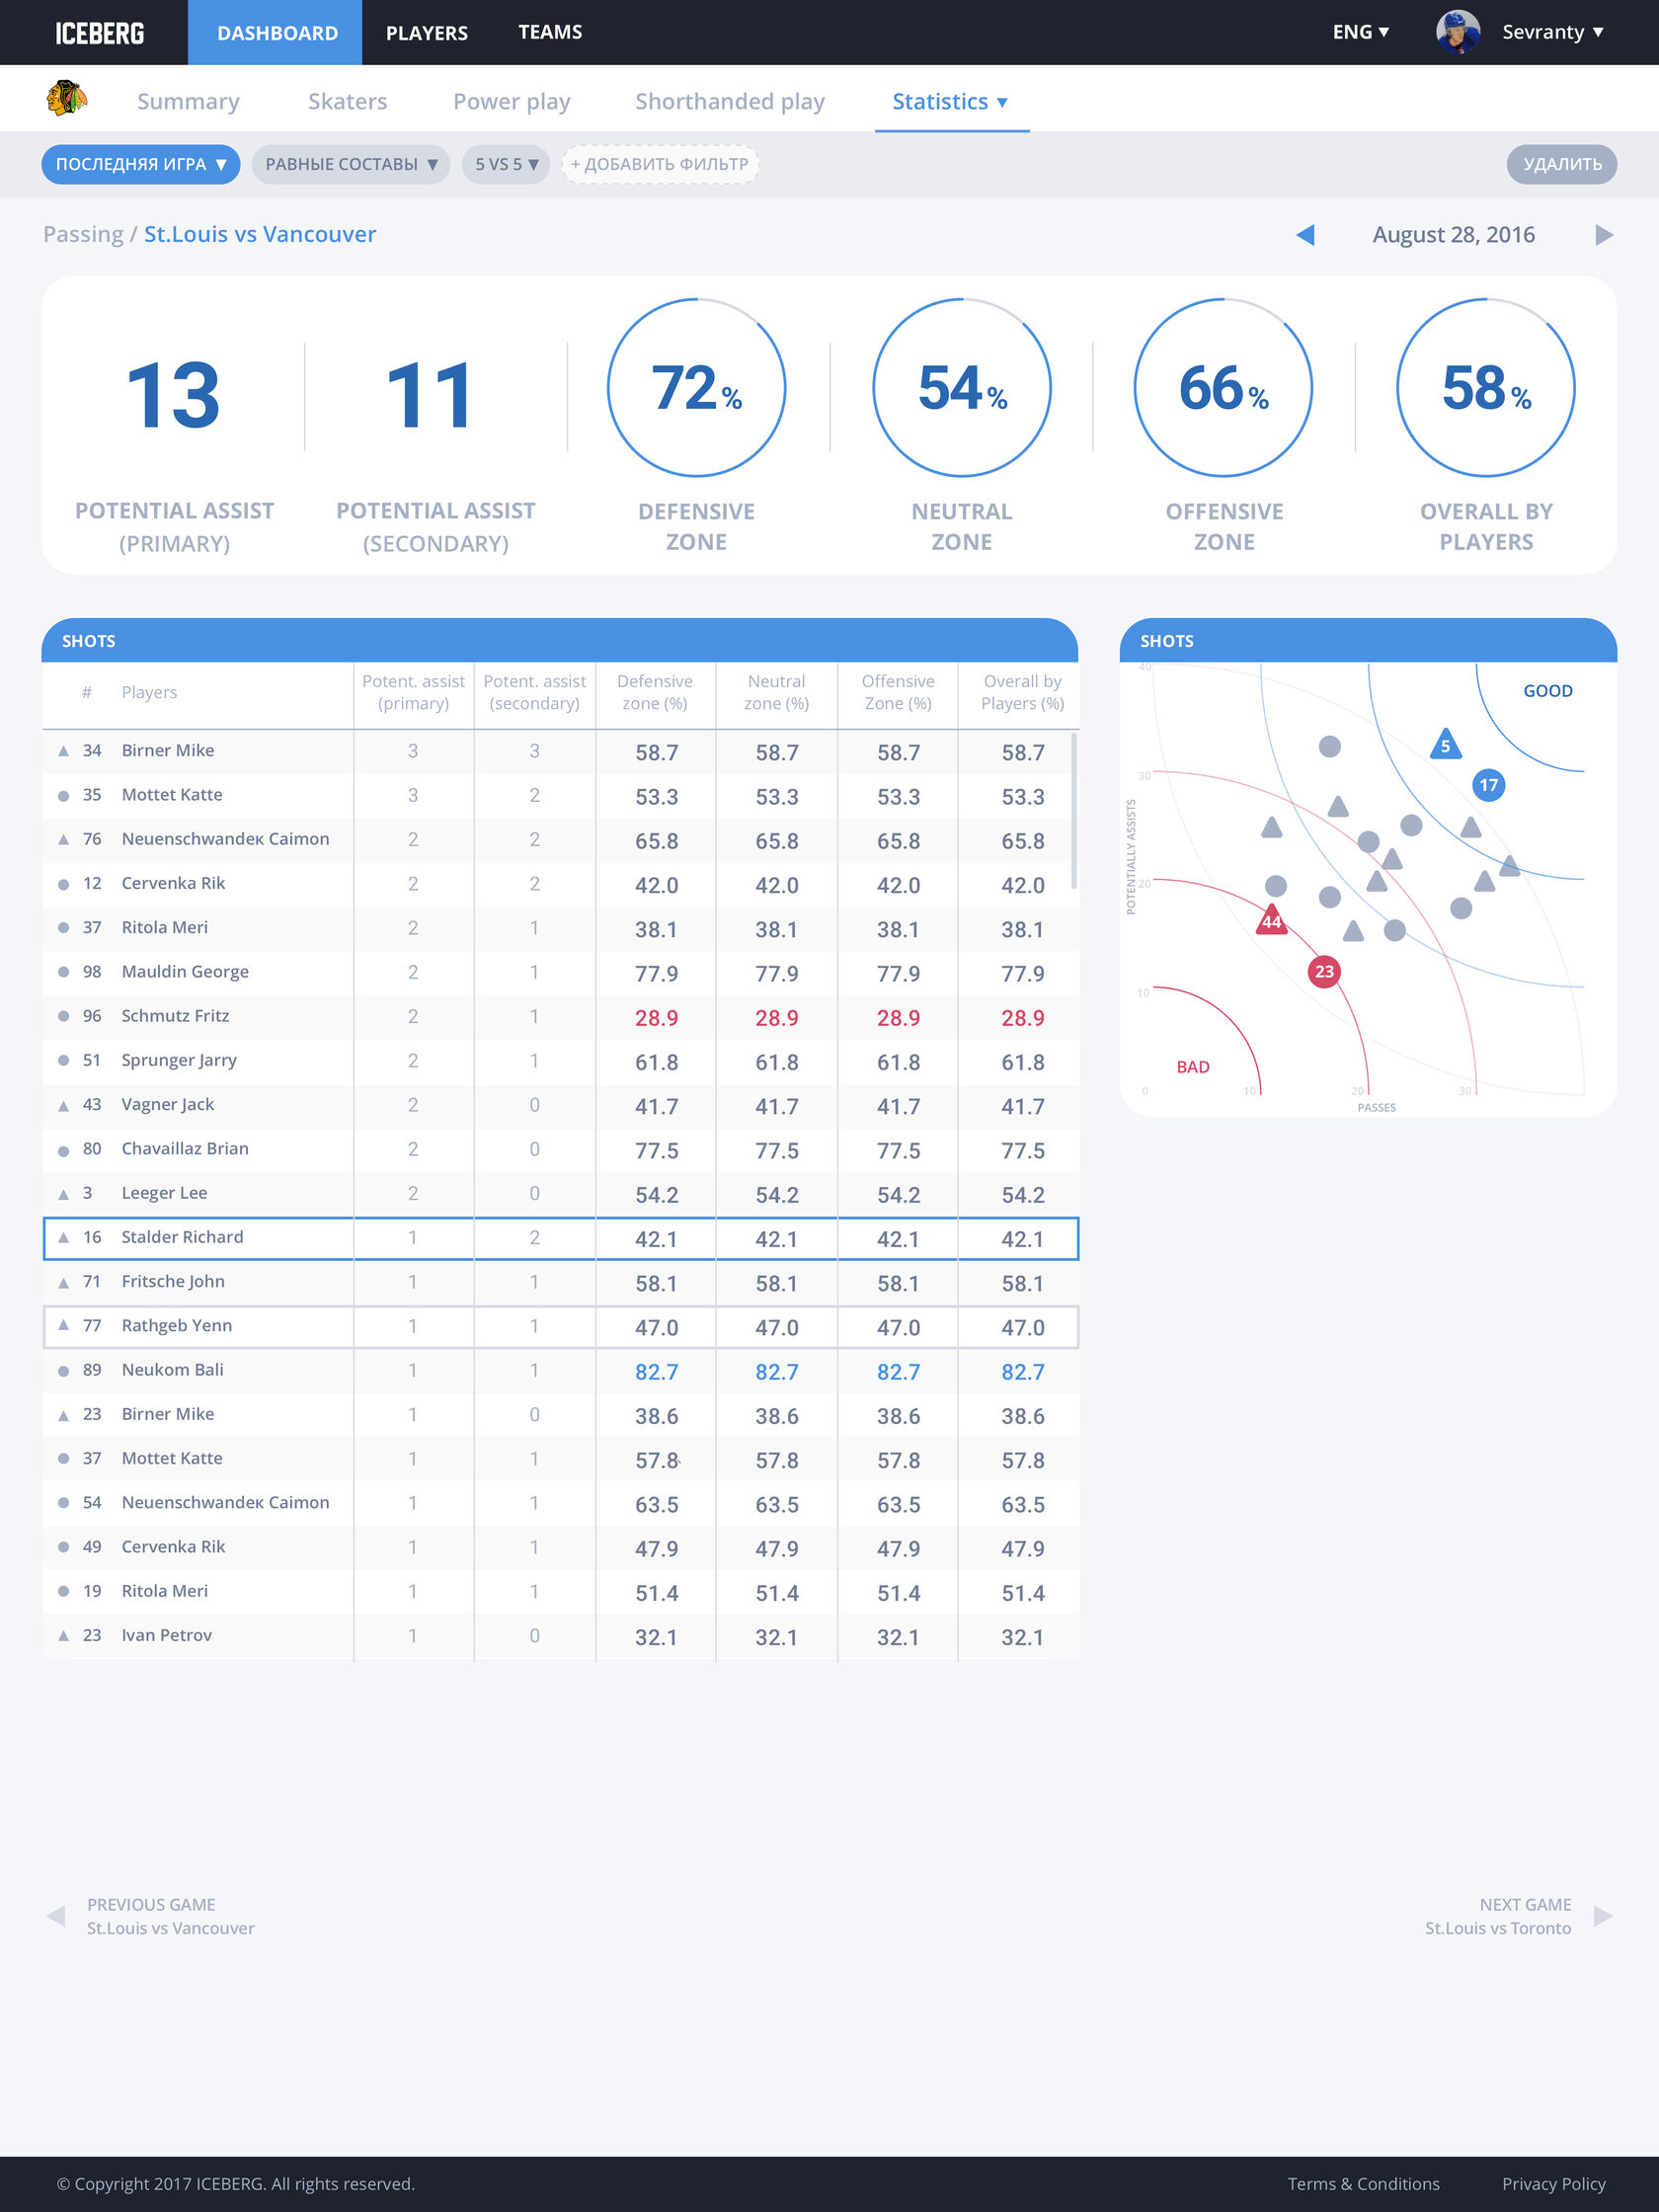
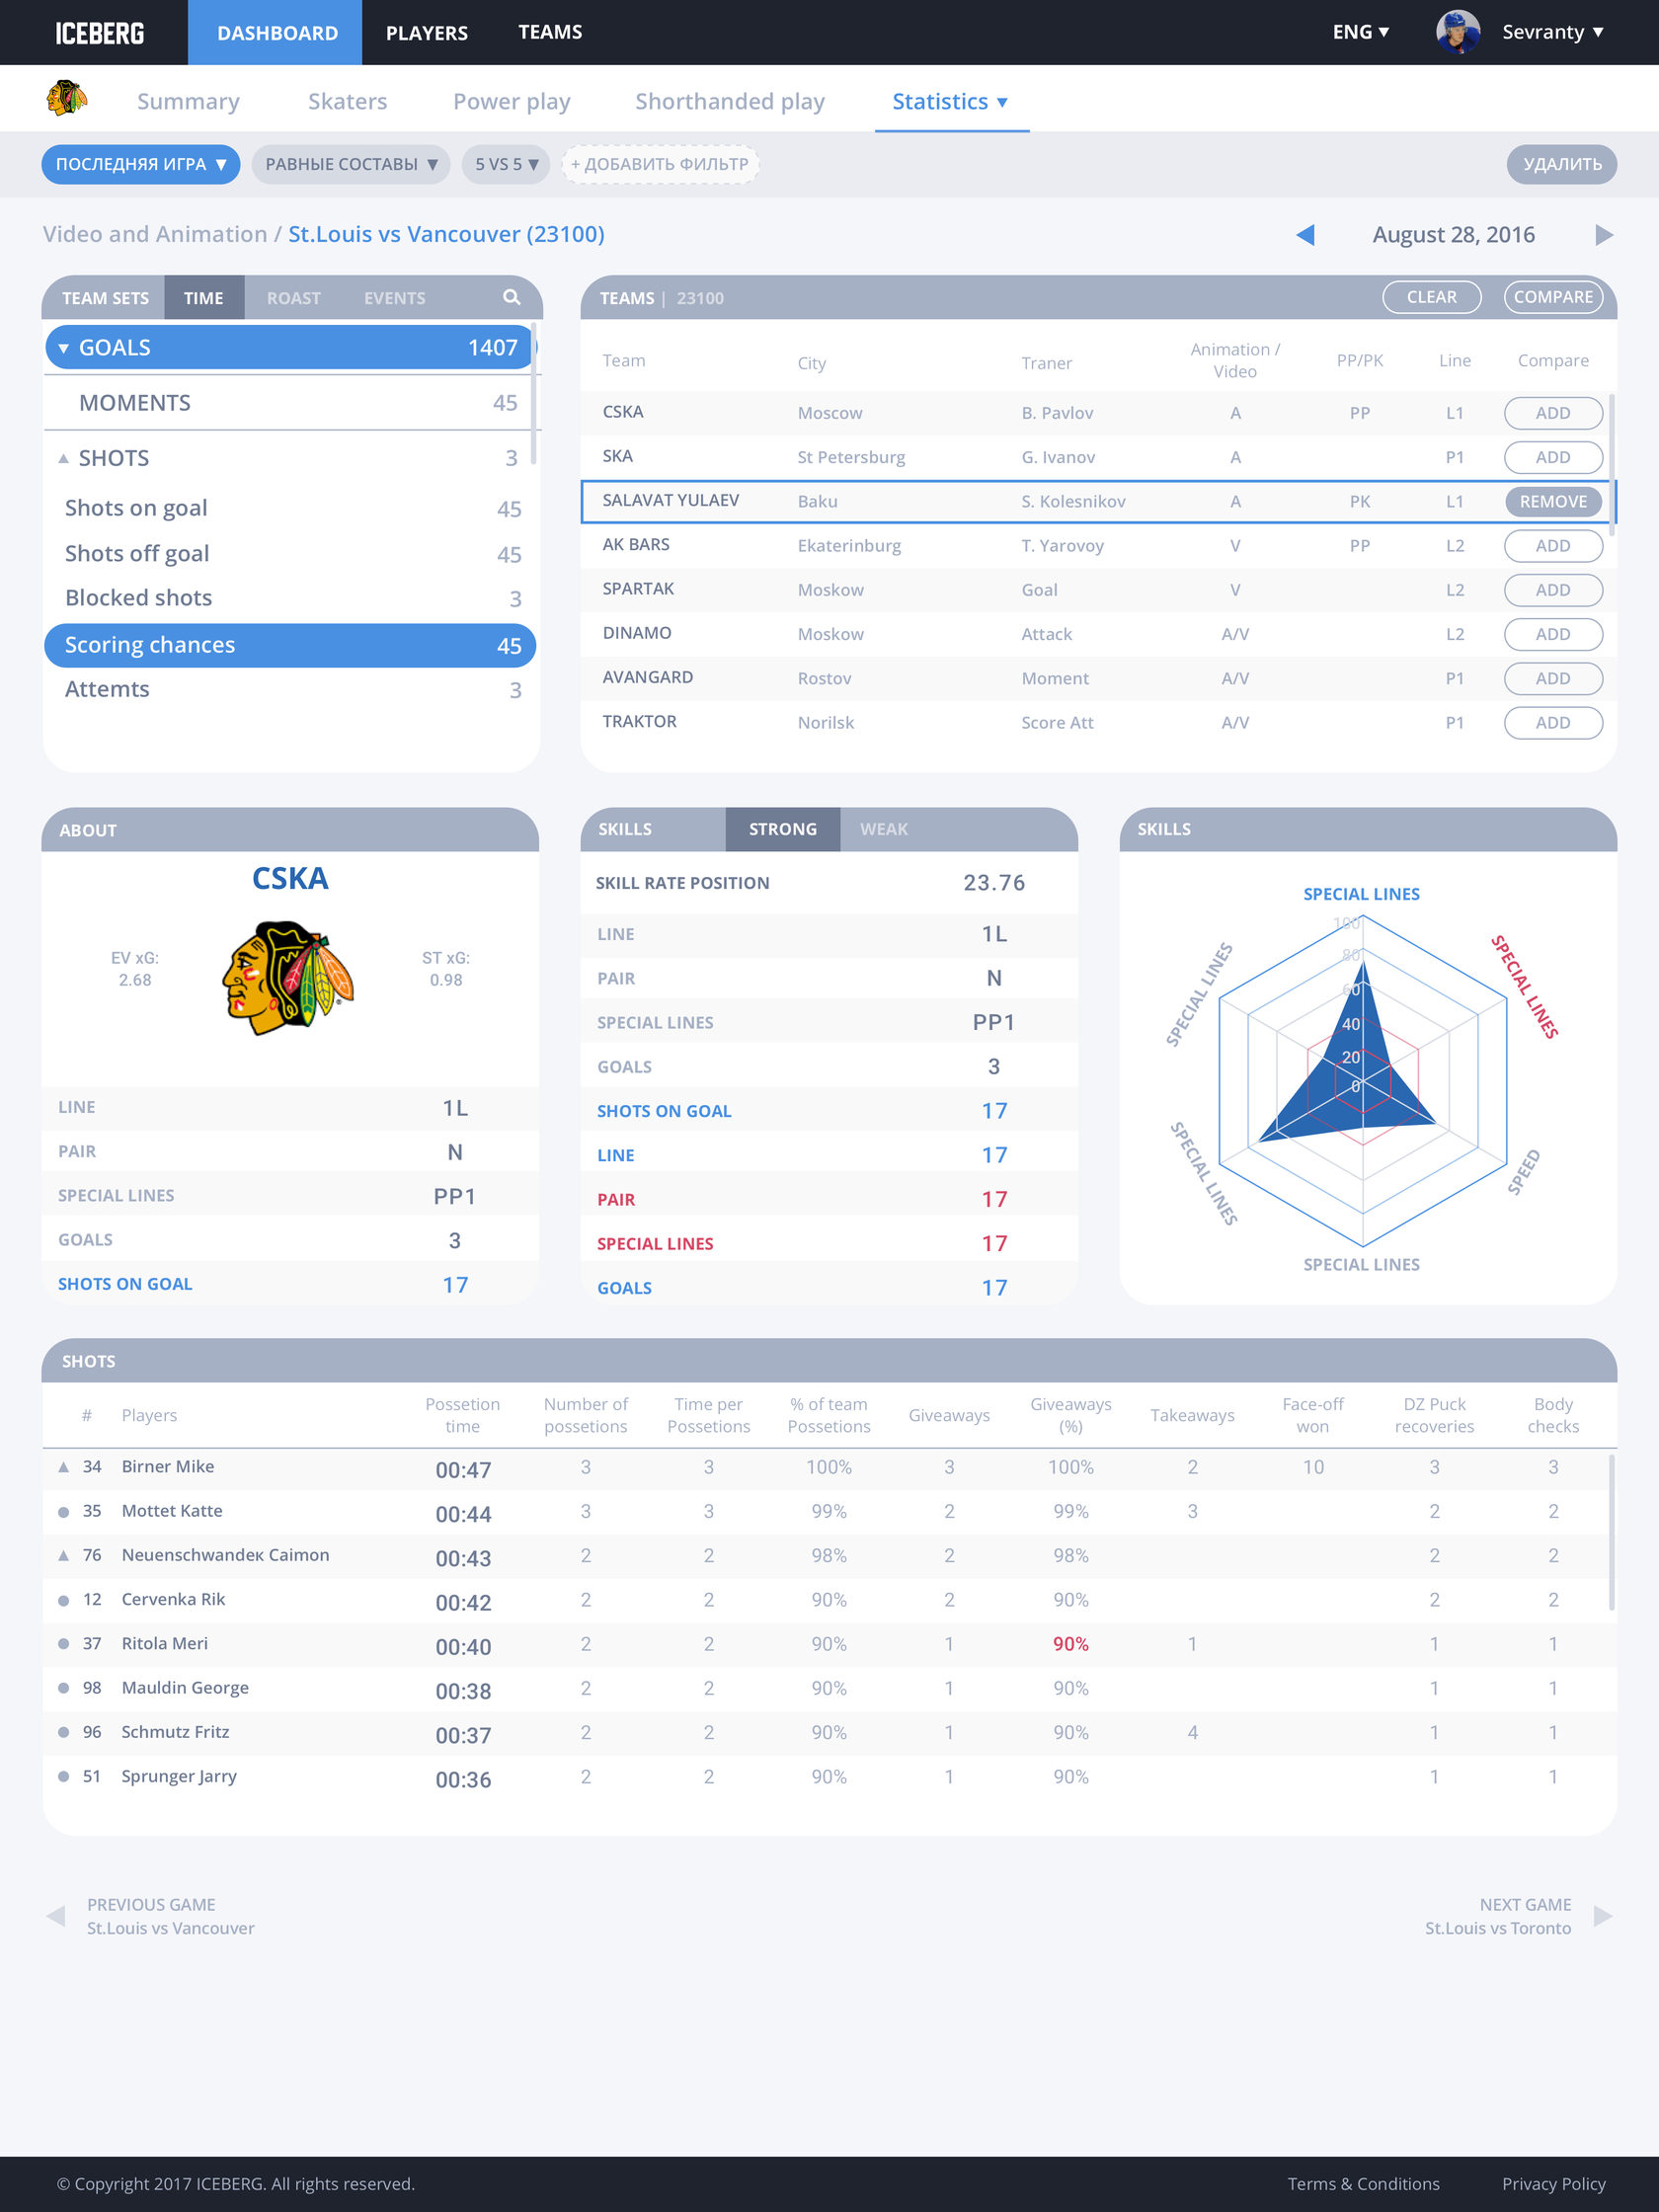
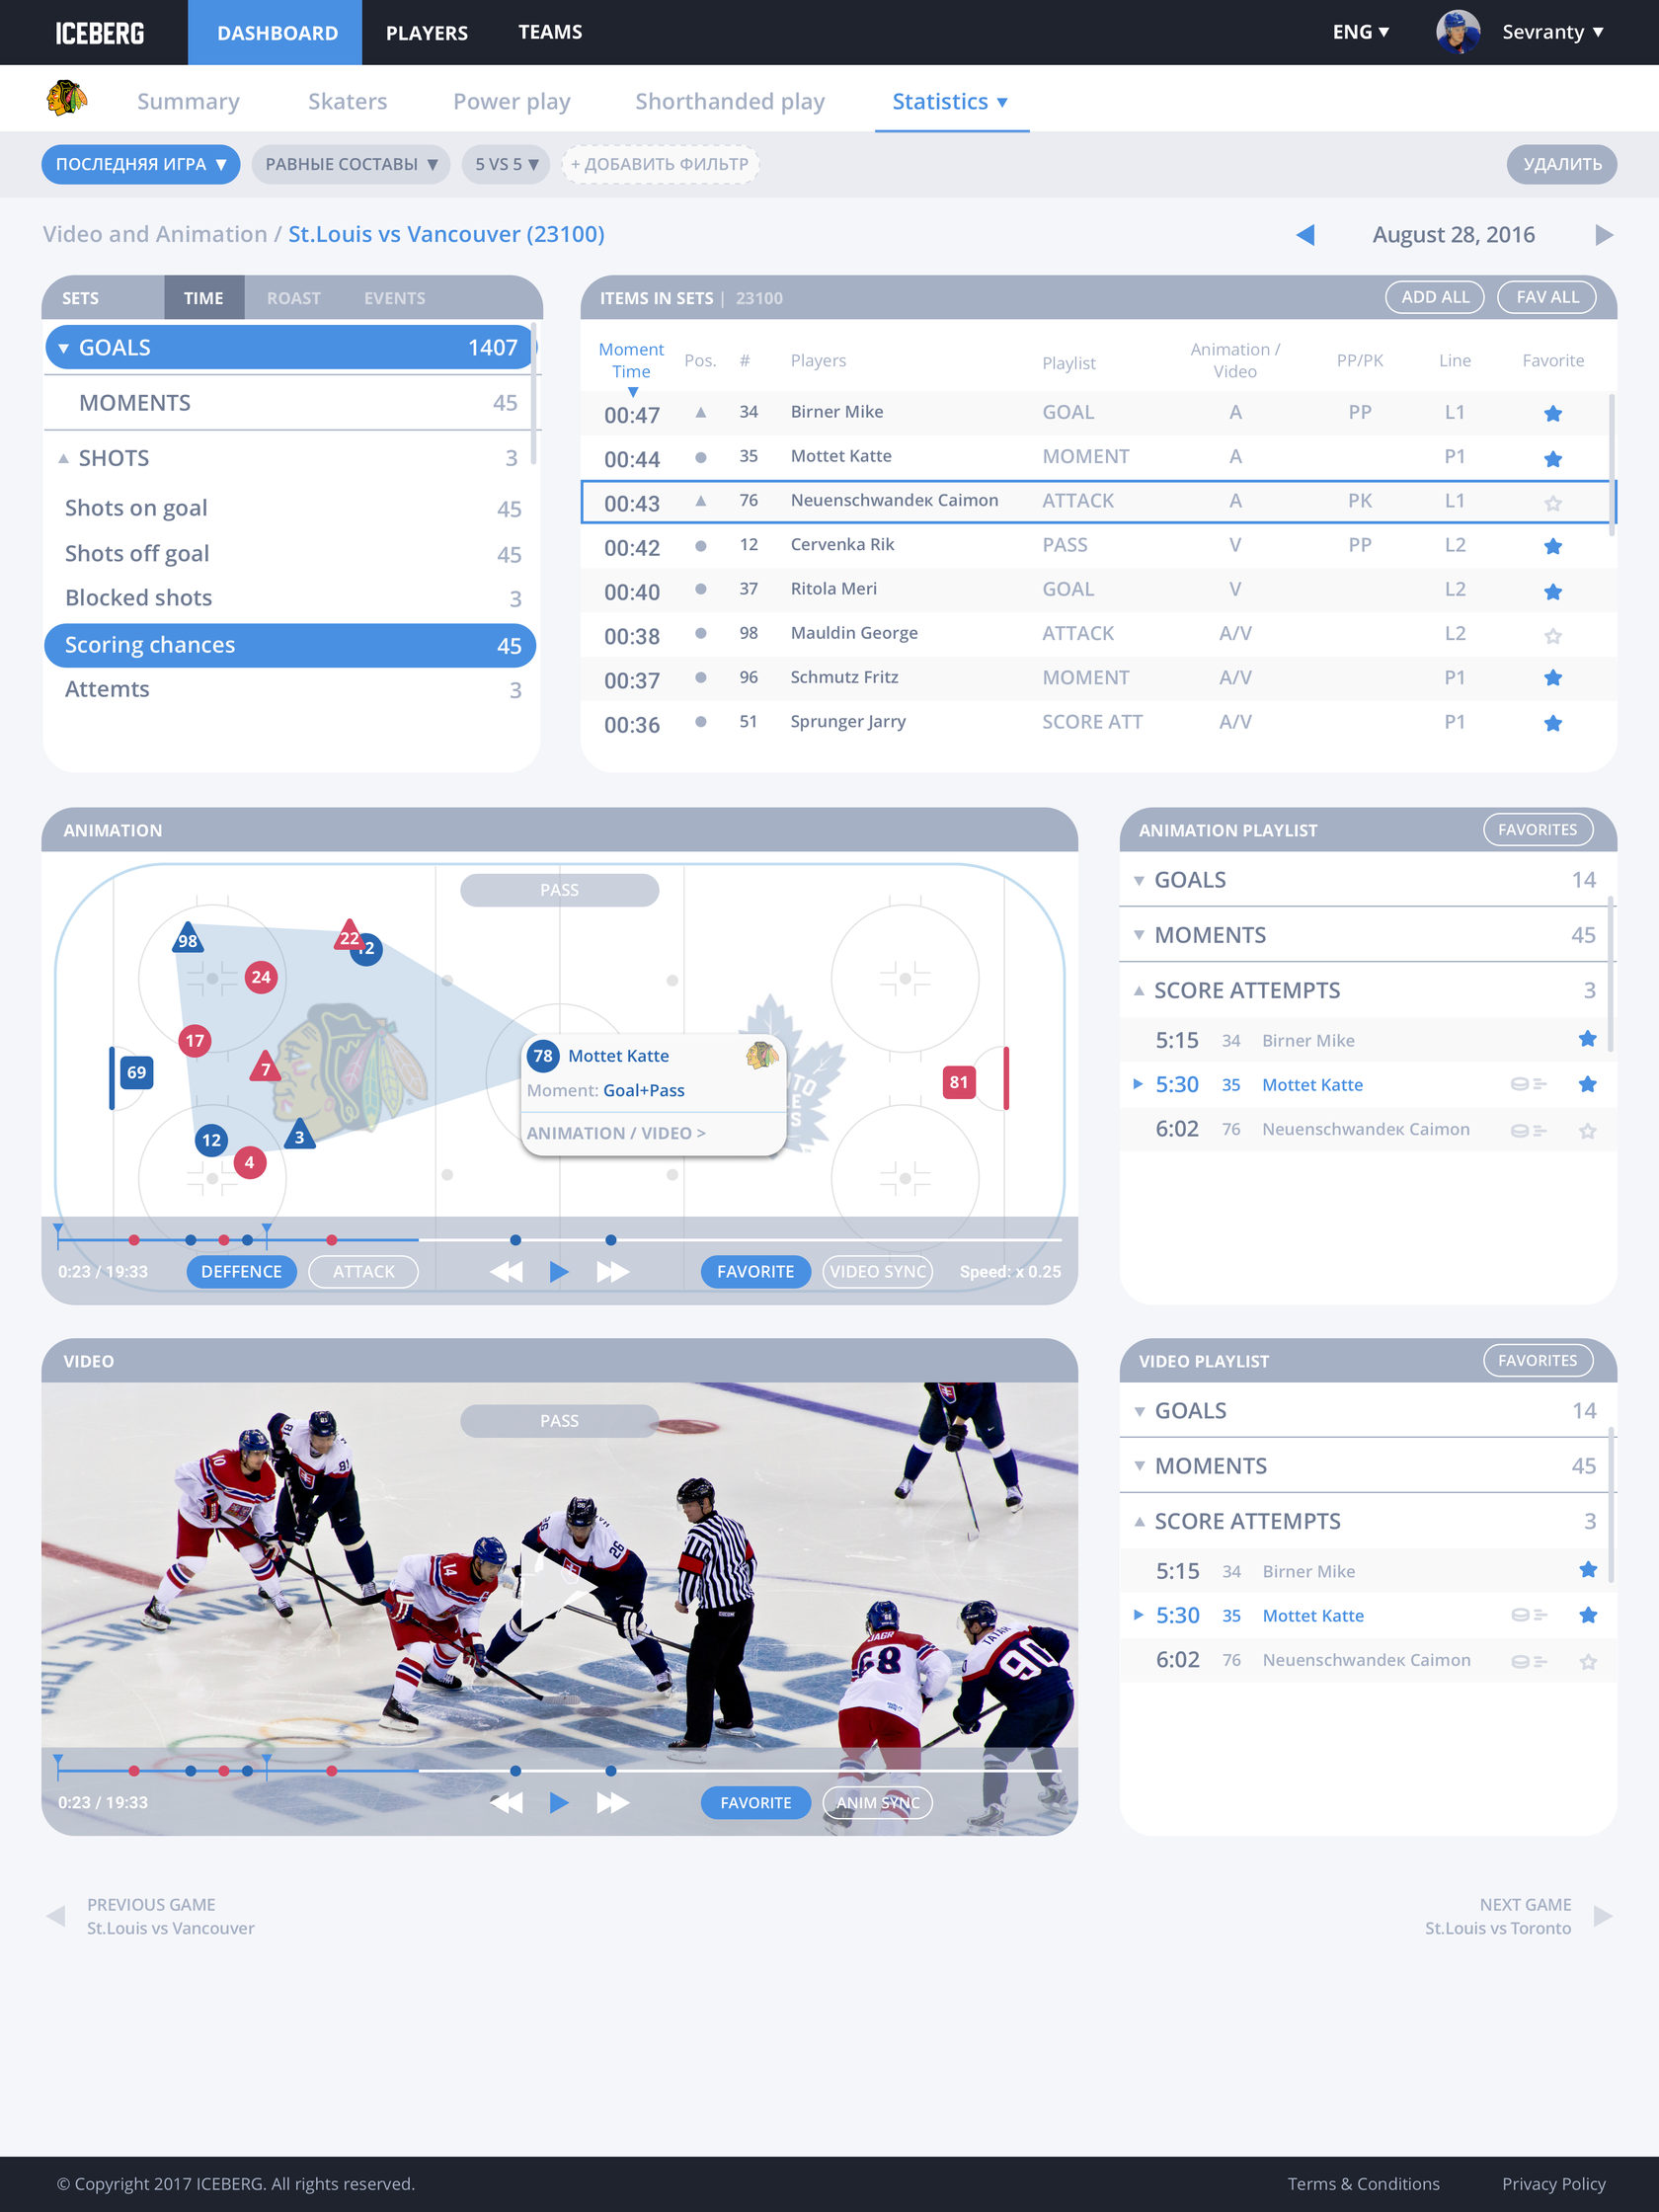
This product contains a huge amount of professional data, which needed to be clearly, visually represented.
I analysed the data to create different types of visual interpretations.
I analysed the data to create different types of visual interpretations.
UIUX design
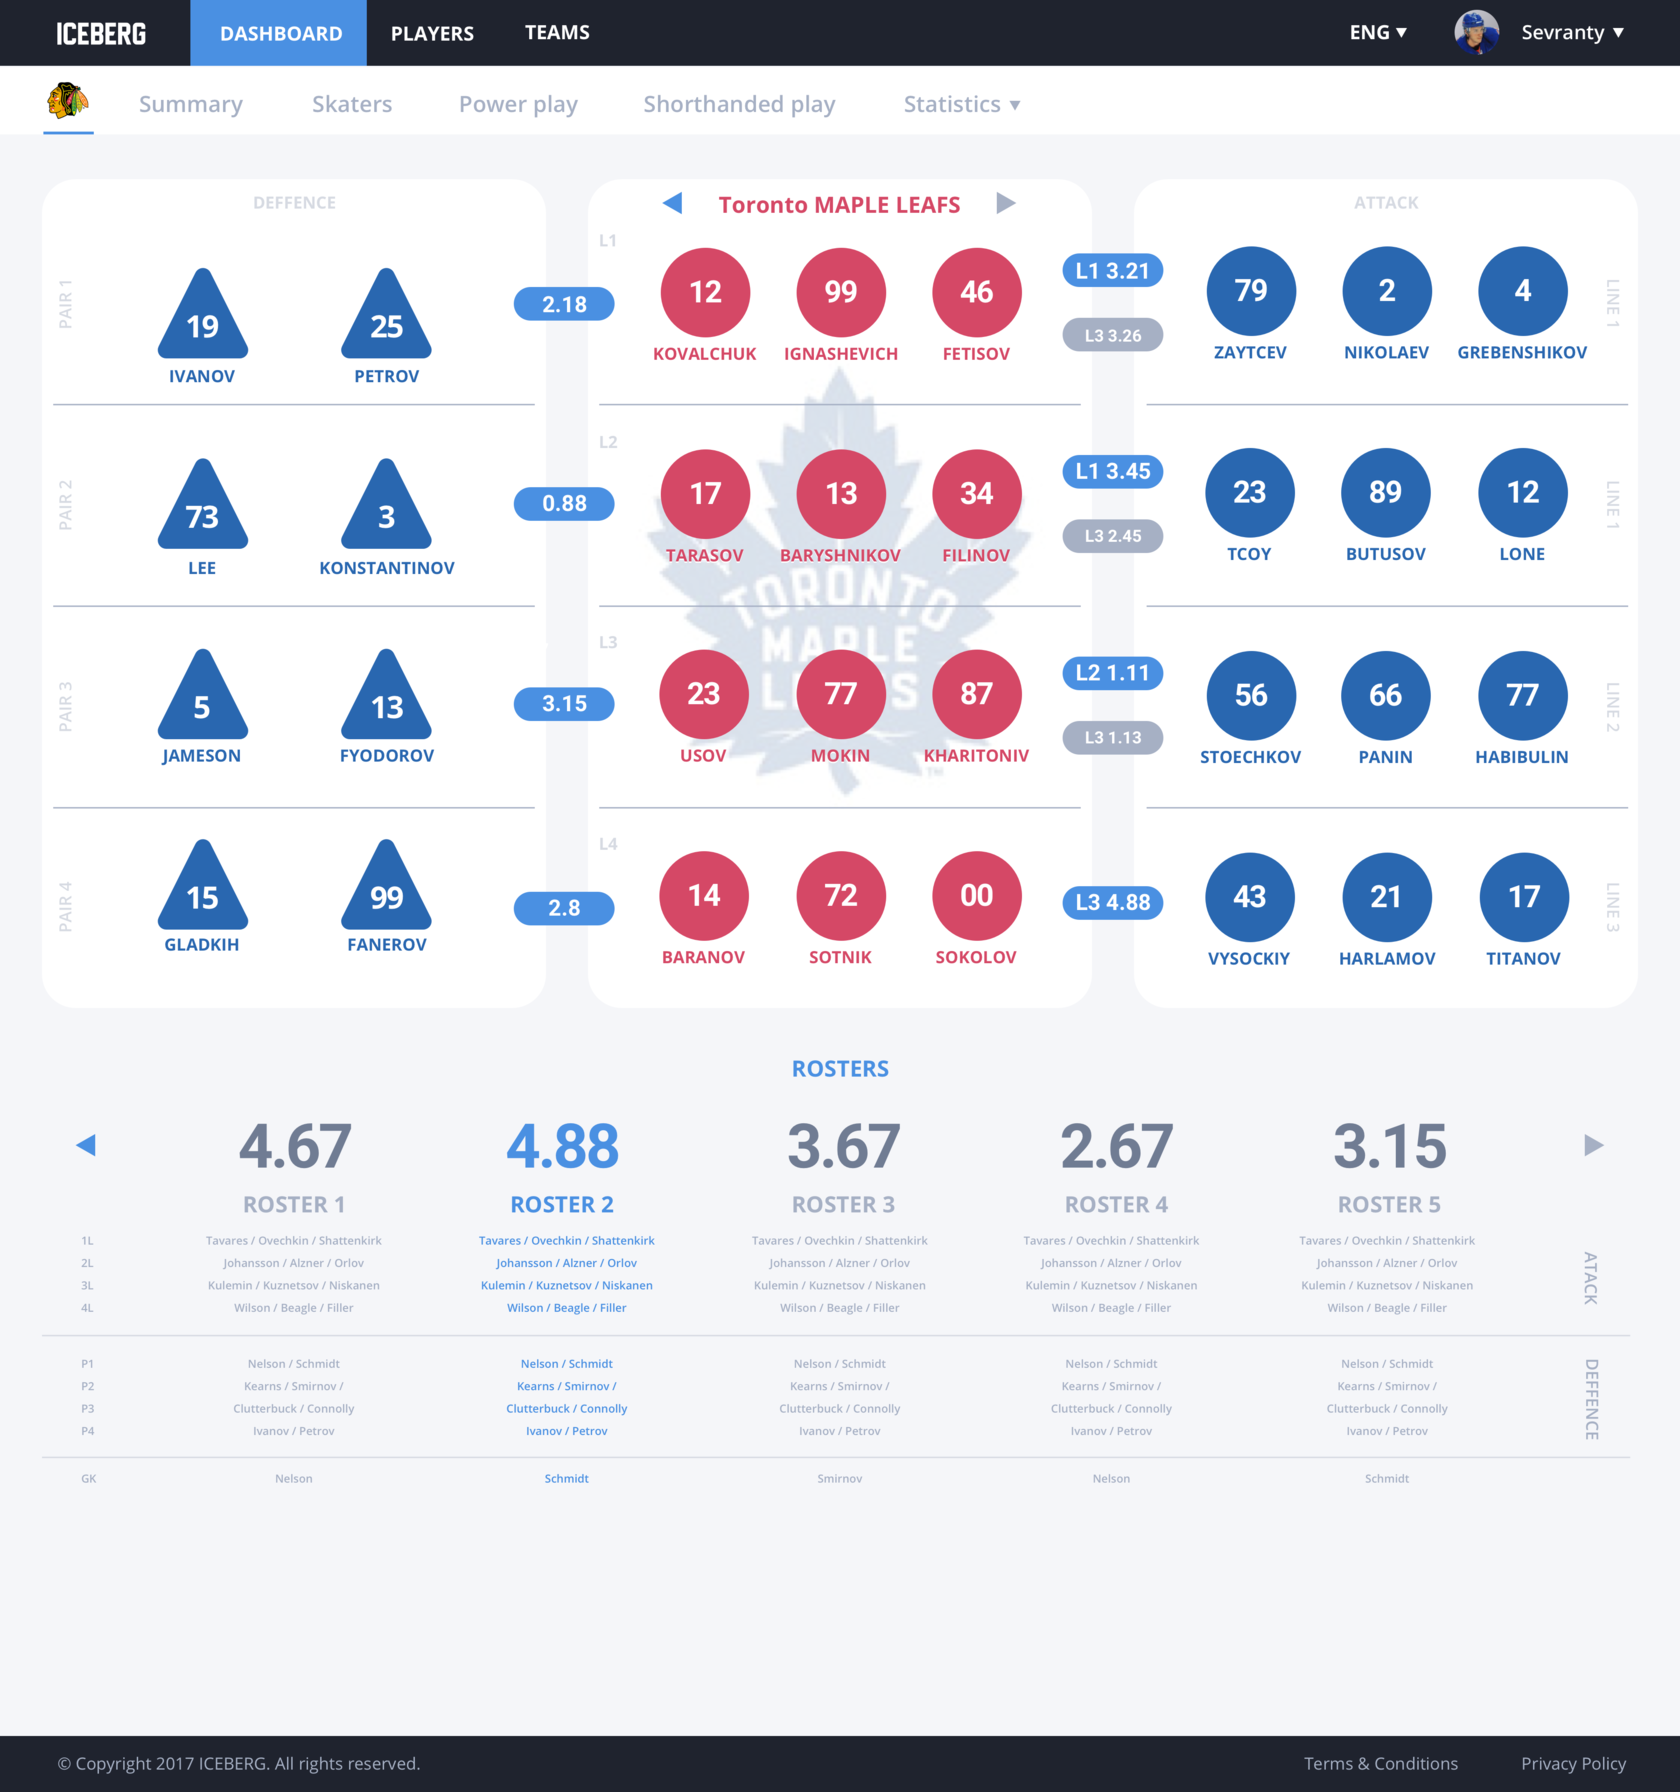
Iceberg can be used on the web, a tablet and even a mobile device, although with limited functionality. Thanks to the widget system, it can be customised according to a particular customer's needs.
It was checked and verified by a number of professional KHL and NHL team trainers, including Vladislav Tretyak, a hockey legend and the president of the Ice Hockey Federation of Russia.
It was checked and verified by a number of professional KHL and NHL team trainers, including Vladislav Tretyak, a hockey legend and the president of the Ice Hockey Federation of Russia.

Evgeniy Khokhlov
Our company uses game video analytics to provide services to the coaches, players and scouts of hockey clubs and a few years ago we launched the second version of our analytical portal.
One of the most important tasks was to create usable, clear and contemporary user interface. Unfortunately, a few months before project release, our product designer left. At this tough moment, Stas Leontyev joined our team. He created all the missing UX, redesigned the UI and developed a component library.
He quickly fit into the team and, because of that, we were able to launch the product in time. We've gotten lots of positive feedback about its UX/UI design.